|
Related Topics |
|
In today's blog we take a look at the sentiment across various sectors as measured by our Horizon Chart. It clearly shows which sectors are in and out of favour in the minds of South African investors.
Sectors looked at include:
|

|
Looking at sentiment across sectors
We are often asked which sector investor sentiment is the highest or the best. Well share price growth reflects sentiment in a share, or index level changes reflects sentiment in sectors/industries as a whole. So we have developed this horizontal chart showing sentiment across various sector on one graphic.
So how to read or interpret this graphic? The darker the blue colour the higher the index growth rate , the darker the red colour the bigger the decline in the index level from the starting period selected. Lighter blue colours shows moderate growth in index levels from the starting point, while lighter red/orange colours shows more muted declines in the index levels from the selected starting point.
Lighter colours and smaller peaks, shows more stable index levels (I.e not a lot of upwards or downwards movement in the index in question.
As can be seen from the graphic the sentiment in technology and consumer goods shares have been exceptionally strong over recent years, while it has been extremely negative in basic materials and health care. Financials have been relatively stable based on the low peaks in the graphic and the very light colours shown by the financials.
Users can adjust the starting date and the graphic will recalculate. Note it will take some time as significant processing is required in recalculating the sentiment graphic. The two images below shows the sentiment for the last 12months vs sentiment across sectors for the last 4 years.
Users can adjust the starting date and the graphic will recalculate. Note it will take some time as significant processing is required in recalculating the sentiment graphic. The two images below shows the sentiment for the last 12months vs sentiment across sectors for the last 4 years.
1 Year
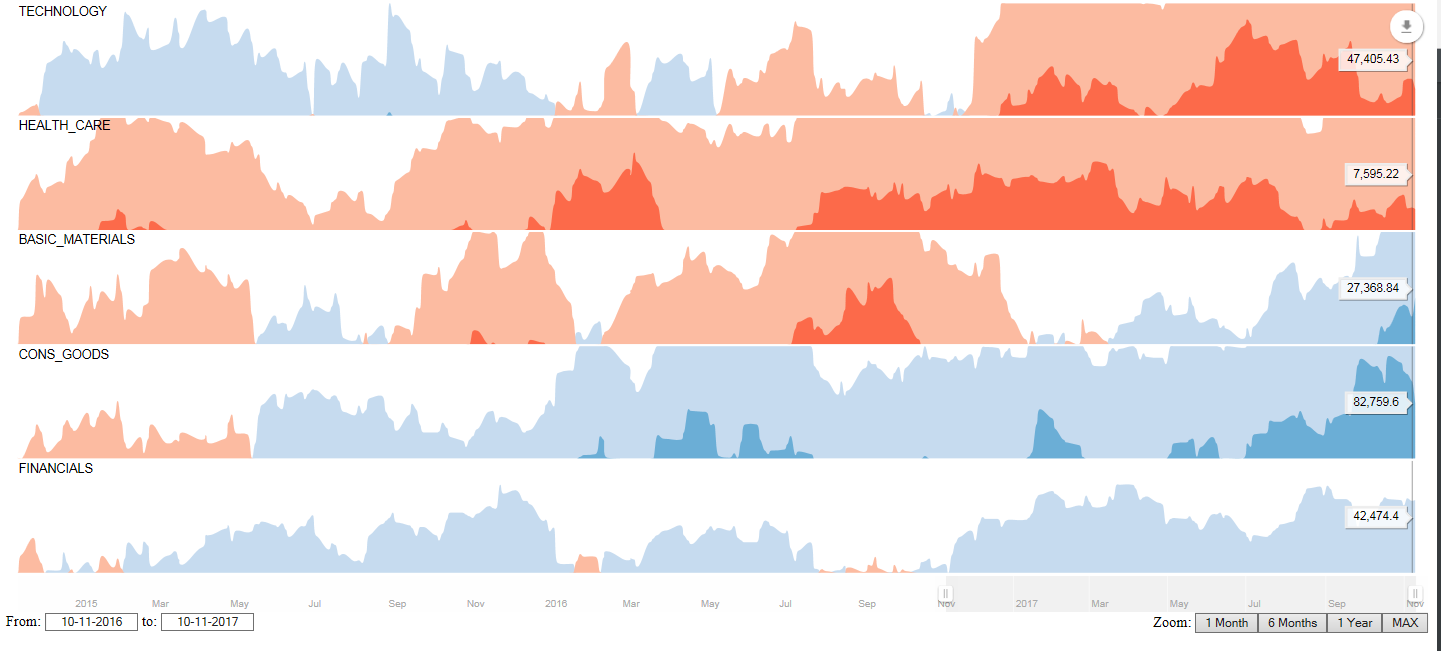
The image above shows that the healthcare and technology sectors have taken an absolute pounding over the last 12 months (the dark orange colours at the end of the period showing strong declines ). No doubt Tech heavyweight EOH contributing to the decline in the sector over the last 12 months. According to Sharenet.co.za, EOH's share price is down by almost 37% over the last 12 months. The consumer goods sector and basic materials sectors have shown relatively strong gains over the last 12months, with dark blue colours showing at the end of the period showing strong positive gains. The picture over the last 4 years looks a little different
4 Years
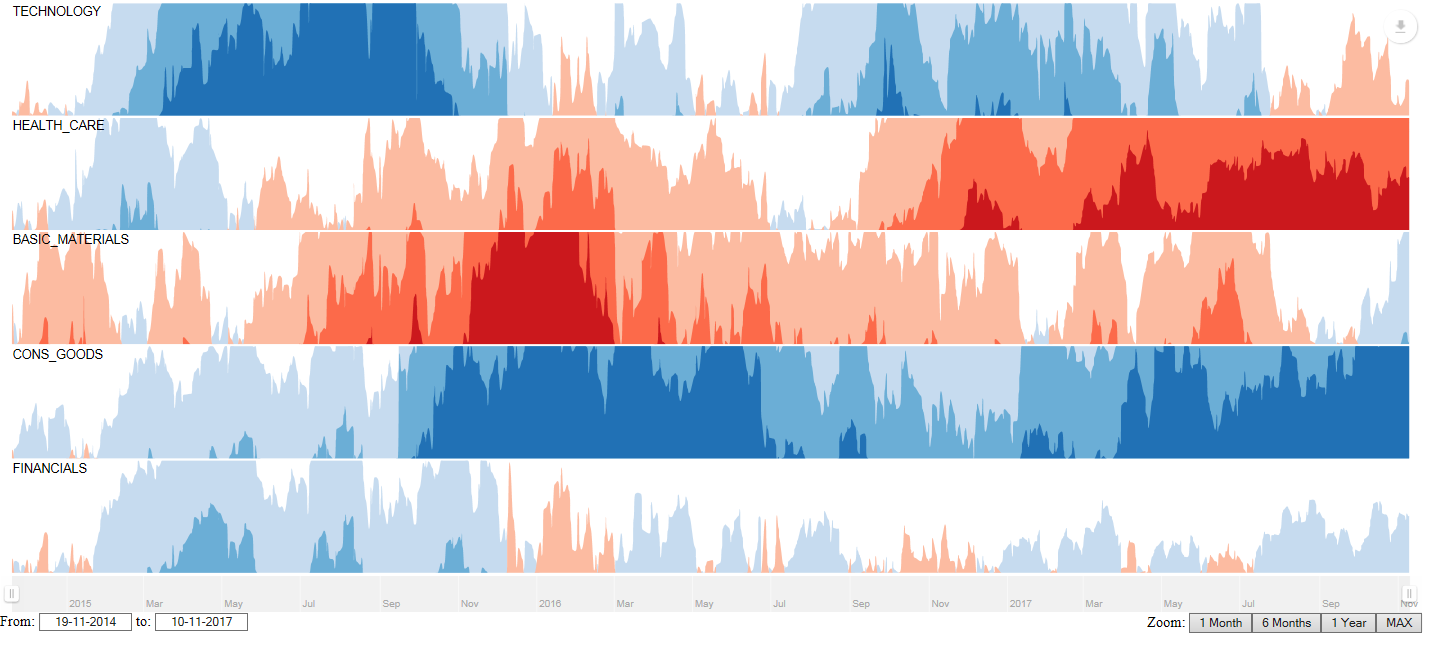
When looking at sentiment over a 4 year period one can see the technology sector which has taken massive strain over the last 12months as shown earlier, actually achieved very strong growth around 3 years ago. In fact it showed strong growth for most of the period in question, except the last number of months in which strong declines have taken place.
The healthcare sector has been in the decline for a number of years now, and the dark red colours showing very strong declines when compared to the index levels at the start of the series.
Basic materials have shown modest increases (light blue colour at the end of the graphic above) over the last 4 years. The consumer goods sector showing by far the best returns and this the best sentiment of all the industries in this comparison graphic. Sustained periods of dark blue showing strong gains compared to the index levels at the start of the series.
The Financial index has been relatively stable over the last 4 years. No sustained periods of dark blue, or dark red. Showing that the index has moved around the levels of that of the start of the period without significant gains or losses in the sector as a whole. (The lighter colours of this sector shows the relatively stable behavior of this sector). From the relatively flat returns one would assume sentiment towards this sector is neutral.