|
Related Topics |
|
We take a look at the latest interim financial results from listed pharmaceuticals group, Aspen (APN) and based on the share price plunge after the results announcement it is clear the market is not liking the company's financial results AT ALL.
|
|
About Aspen (APN)
This year we celebrate our 20th anniversary as a JSE-listed company. Established from humble beginnings in Durban South Africa, and with a 160 year heritage, we have grown into a leading specialty and branded multinational pharmaceutical company. Our extensive basket of high quality, affordable products treat a broad spectrum of acute and chronic conditions experienced through all stages of life.
Our core categories that receive our highest focus include Regional Brands, Anaesthetics, Thrombosis, High Potency & Cytotoxics and Nutritionals.
Our manufacturing capabilities are scaleable to demand and cover a wide variety of product types including injectables, oral solid dose, liquids, semi-solids, steriles, biologicals, active pharmaceutical ingredients and nutritionals. We operate 25 manufacturing facilities across 17 sites and we hold international manufacturing approvals from some of the most stringent global regulatory agencies listed here including, among others, the United States Food and Drug Administration, the Australian Therapeutic Goods Administration and the European Directorate for the Quality of Medicines.
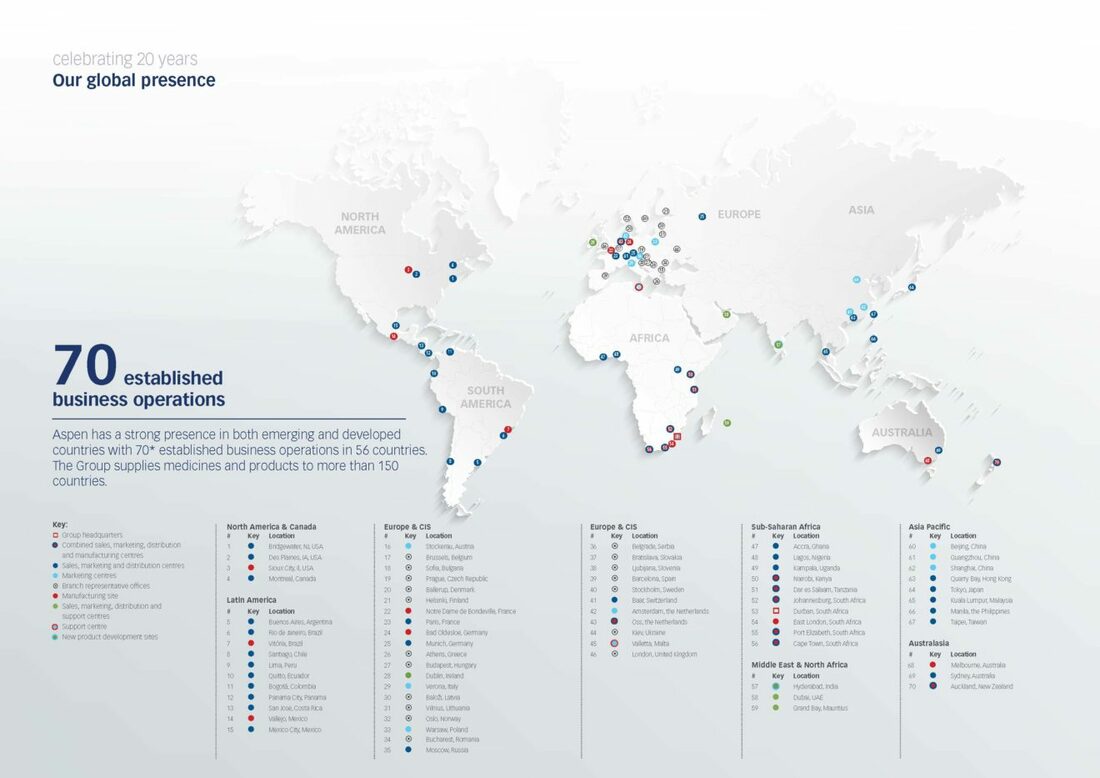
The image below shows Aspen's geographical footprint:
Our core categories that receive our highest focus include Regional Brands, Anaesthetics, Thrombosis, High Potency & Cytotoxics and Nutritionals.
Our manufacturing capabilities are scaleable to demand and cover a wide variety of product types including injectables, oral solid dose, liquids, semi-solids, steriles, biologicals, active pharmaceutical ingredients and nutritionals. We operate 25 manufacturing facilities across 17 sites and we hold international manufacturing approvals from some of the most stringent global regulatory agencies listed here including, among others, the United States Food and Drug Administration, the Australian Therapeutic Goods Administration and the European Directorate for the Quality of Medicines.
The image below shows Aspen's geographical footprint:
Financial Results Overview
Firstly we take a look at the financial highlights as stated by APN's management
Now for the numbers we are interested in:
- Revenue: R19.673 billion (up 1% from R19.509 in the prior period)
- Normalised EBITDA: R5.534 billion (down 3% from R5.711 billion in the prior period)
- Normalised Headline earnings per share: R7.43 (down 9% from R8.14 in the prior period)
Now for the numbers we are interested in:
- Revenue: R19.673 billion (up 1% from R19.509 in the prior period)
- Normalised EBITDA: R5.534 billion (down 3% from R5.711 billion in the prior period)
- Profit for the period: R2.87 billion (up 16% from R3.4 billion in the prior year)
- Net profit margin: 14.6%
- Normalised Headline earnings per share: R7.43 (down 9% from R8.14 in the prior period)
- PE ratio: 6.8 (assuming second half year earnings is the same as interim period earnings(
- Dividend declared for period: None in interim period
- Dividend yield: 3.15% (using last year's full year dividend as the guide)
- Cash generated from operating activities : R1.7 billion (down -43% from R3 billion in the prior year)
- Cash generated from operations per share: R3.72 per share
- Net asset value per share: R114.67 (up 19.1% from R96.26 in the prior year)
- So trading at about -12.6% discount of its stated net asset value.
- Cash on balance sheet: R9.5 billion (up 16.7% from R8.45 billion in the prior year)
- Cash on balance sheet per share: R20.8 or 20% of the current share price
Management commentary on the results
Sterile Focus Brands
Sterile Focus Brands, comprising the Anaesthetics and Thrombosis portfolios, delivered revenue in line with the prior comparable period at R7,8 billion. The gross profit from Sterile Focus Brands of R4,3 billion was at an improved gross margin percentage benefitting from lower Thrombosis manufacturing costs.
Anaesthetics Brands
Revenue from Anaesthetics was 1% lower at R4,4 billion. This is a sound performance given ongoing supply constraints affecting all major territories other than Japan. China (+6%) and Latin America (+22%) are the material regions driving growth. Supply limitations have adversely impacted sales in Europe CIS and Australasia. Price decreases in Japan offset strong volume gains. Supply is expected to improve from the commencement of the 2020 financial year and should be unconstrained midway through that year.
Thrombosis Brands
Thrombosis revenue of R3,4 billion is unchanged from the prior comparable period. Emerging Markets are up 7%, propelled by a strong performance in China, which offsets the declines in Developed Markets.
Other Pharmaceuticals
Other Pharmaceuticals, comprising Regional Brands and Manufacturing, deliver revenue of R11,9 billion, flat with the prior comparable period.
Regional Brands
Regional Brands, which comprise 45% of Group revenue, have shown growth of 3%. The High Potency & Cytotoxic Brands have been reclassified under Regional Brands in line with a change to regional management of this portfolio. Revenue growth has been recorded in most territories, but this has been partially offset by pricing pressure on the oncology portfolio in Europe, that also dilutes the margins.
Manufacturing
Manufacturing revenue declines 10% to R3,0 billion, primarily due to a tender lost in the prior year by one of Aspen's major third-party customers (as reported in the results announcement for the 2018 financial year) and the suspension of sales of heparin to third-parties due to limited global availability. Resultant lower volumes weigh on margins.
Funding
Borrowings, net of cash, have increased by R6,7 billion to R53,5 billion. R1,0 billion of this increase is the consequence of Rand weakness relative to foreign currency denominated loans. Payments relating to acquisitions of R4,9 billion and capital expenditure of R1,5 billion have been the main other drivers of the higher debt levels. The gearing ratio covenant measure is 4,43 times against an upper threshold of 4,75 times in terms of the temporary amendment to this covenant measure. Operating cash flows have been constrained by an increased working capital investment, largely due to strategic stock builds. Operating cash flow per share of 317 cents represents a 47% rate of conversion of operating profit. Net interest paid is covered five times by EBITDA.
De-leveraging the balance sheet is a priority. The first steps in this process are well progressed with the pending receipt of the proceeds from the Nutritionals disposal, estimated at EUR635 million, in addition to the inflows received and expected from the divestment of the non-core pharmaceutical portfolio in the Asia Pacific region. This will bring the gearing ratio covenant measure within the specified level of 4,0 for each of the June and December 2019 measurement periods. Aspen's medium-term target for the gearing ratio is less than 3,0. Opportunities to accelerate the achievement of this target include the aforementioned potential collaborations in Europe and the ongoing assessment of opportunities to realise value.
PROSPECTS
The pending completion of the Nutritionals disposal will allow complete focus on pharmaceuticals. Aspen has embarked on a strategic review of its European and South African Commercial Pharmaceuticals businesses. As an outcome of the first phase of the South African review it has been decided to split South African Commercial Pharmaceuticals into two distinct divisions in order to achieve heightened product and customer focus. The second phase of the review will concentrate on developing strategies specific to each division to optimise value delivery. Any re-shaping of the Group will be aimed at driving sustainable organic growth with a strong emphasis on Emerging Markets. Achievement of the de-leveraging objectives will provide headroom for further investment in building Aspen's product portfolio of niche specialty pharma brands in Emerging Markets. The Group's most promising pipeline opportunities in the short to medium term are with the women's health products that are being developed for launch in the USA. Aspen has reached a memorandum of understanding with a partner that is committed to building a women's health franchise in that country. The partner will distribute Aspen's pipeline products in this therapeutic area in the USA. Normalised headline earnings from continuing operations (at CER) for the full year are expected to be in line with the percentage decline recorded in the first half. Given the diversity of currencies to which the Group is exposed, exchange rate volatility could influence reported results. Operating cash flows are cyclically stronger in the second half of the financial year and a conversion rate of operating profits to cash of between 90% and 100% is anticipated for the full financial year.
Share Price Performance
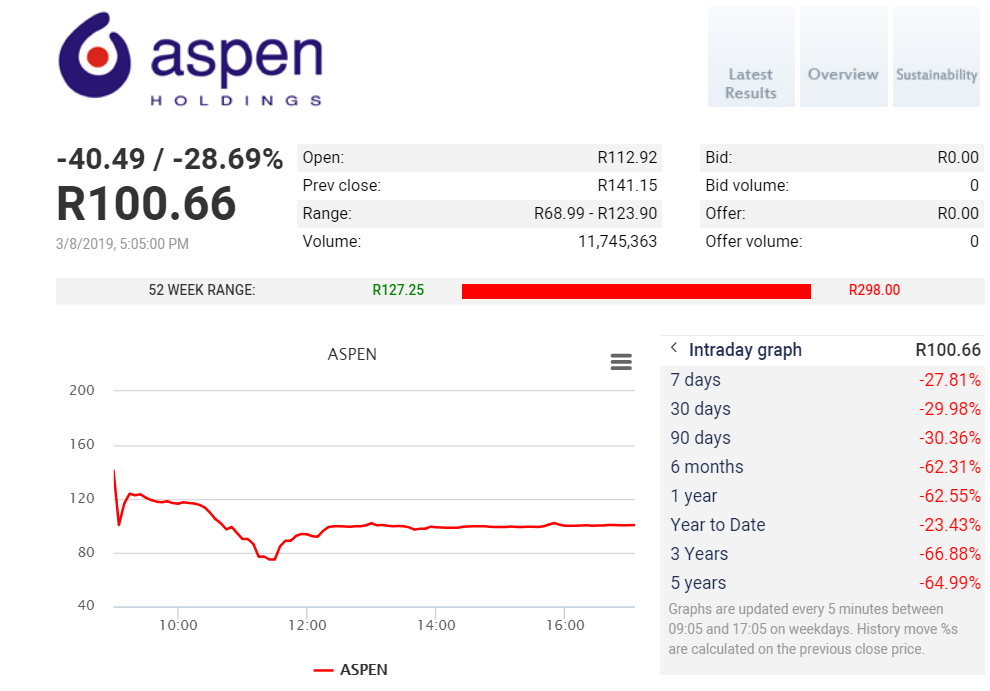
The screenshot below, taken from Moneyweb shows the share price performance of APN over the last 3 years. It also shows the stock's performance over various time frames as well as the sharp decline in the share price today following the release of the financial results yesterday.
The summary below shows the performance of MTN's share price over various time periods:
So its clear APN shares have really been struggling, and there has been little no relief for investors in the stock, it doesn't matter what time from one looks at, the company has not been providing investors with positive returns. And the market's reaction to their financial results has been brutal. And this is due to the fact that there is a large amount of fear built into the company's stock price given its poor performance over the last number of years.
- 1 week:- 27.8%
- 1 month: -29.98%
- Year to date (YTD): -23.43%
- 1 year: -62.55%
- 3 year: -66.9%
- 5 year: -64.99%
So its clear APN shares have really been struggling, and there has been little no relief for investors in the stock, it doesn't matter what time from one looks at, the company has not been providing investors with positive returns. And the market's reaction to their financial results has been brutal. And this is due to the fact that there is a large amount of fear built into the company's stock price given its poor performance over the last number of years.
Aspen (APN) Shares valuation
So no for the difficult part. Attaching a value to the company's shares. They have ballooning debt, declining margins as well as declining cash generating capacity. They are highly leveraged, but they trade at a very low PE ratio and has a significant chunk of cash on their balance sheet. It is tough to attach a value, but the guidance provided by management basically stated that they expect profits to decline with a similar percentage that was reported in this period in their year end results.
All things considered we value APN shares at R124 a share. So at the current price they offer a bit of value, but it will take a brave investors to buy them now, as the old adage says, don't try and catch a falling knife. Wait until the market has had time to digest the results and trading to stabilize, then look to buy if you willing to take a risk. We do feel the market overreacted to the results and wont be surprised to see APN back at around R120 soon
All things considered we value APN shares at R124 a share. So at the current price they offer a bit of value, but it will take a brave investors to buy them now, as the old adage says, don't try and catch a falling knife. Wait until the market has had time to digest the results and trading to stabilize, then look to buy if you willing to take a risk. We do feel the market overreacted to the results and wont be surprised to see APN back at around R120 soon