|
Related Topics |
|
We take a look at the interim financial results of Adcock Ingram for the period ending December 2018. So what has the last 6 months been like for the pharmaceuticals giant?
|
|
About Adcock Ingram (AIP)
Adcock Ingram is a leading South African pharmaceutical manufacturer, listed on the Johannesburg Stock Exchange. The Company manufactures, markets and distributes a wide range of healthcare products. The company is a leading supplier to both the private and public sectors of the market. Adcock Ingram is a level 3 B-BBEE contributor.
Adcock Ingram is ranked as the second largest manufacturer in the private pharmaceutical market and is the second largest supplier to the public sector. Of note is the major share of the critical care market held by the company, being the largest supplier of critical care products to the public sector and hospitals. Adcock Ingram is a committed supplier of antiretroviral (ARV) medicines to the public sector through the highly competitive tender system.
The Consumer division competes in the Fast Moving Consumer Goods (FMCG) space. Iconic brands such as Panado and Compral have given the Company a leadership position in the analgesic market. The product portfolio includes cough and cold preparations, energy supplements, digestive well-being medications, vitamins and feminine hygiene products.
Over the Counter (OTC) supplies medication for patients in South Africa's private and public sector as well as to certain export markets, competing in the self-medication category (Schedule 1 (S1) and 2 (S2)) in Pharmacy, and also in the FMCG channel (Schedule 0 and unscheduled) with an aggregated complement of 103 premium and economy brands.
The division's brand portfolio and operational excellence have assisted in maintaining its volume and value leadership position in Schedule 1 and Schedule 2 in pharmacy. Two in every five packs, S1and S2 products, sold in the private sector, is an Adcock Ingram product.
Financial results overview
Results highlights as stated by Adcock Ingram (AIP)
Now for the numbers we are interested in:
- Turnover up 16% to R3,595 million
- Gross profit improves 18% to R1,390 million
- Trading profit increases 17% to R485 million
- Headline earnings per share increases 16%
- Dividend declared: 100 cents per share
- B-BBEE level 3 achieved
- Operation in Zimbabwe (Datlabs) disposed of in January 2019
Now for the numbers we are interested in:
- Revenue: 3.599 billion (up 15% from R3.122 billion in prior year)
- Cost of sales: R2.2 billion (up 14.1% from R1.928 billion in prior year)
- Gross profit: R1.389 billion (up 18% from R1.180 billion in prior year)
- Net profit: R361.9 million (up 12% from R323.4 million in the prior year)
- Net profit margin: 10.03%
- Headline earnings per share: R2.17
- PE ratio: 15.13
- Interim dividend: R1 a share (up 16% on the prior year's interim dividend)
- Dividend yield: 3% assuming interim dividend is repeated at year end
- Cash generated from operations: R328 million (down -27.9 % from R455 million in prior year)
- Cash generated per share: R1.86 per share
- Net asset value per share: R23.62 (so trading at 2.8 times its book value). Not uncommon for a operating entity with strong profit margins to trade well above its stated net asset value.
Management comment on the results
The following comments were made in the latest results release by Adcock's management.
Introduction
The Board is pleased to report that the business operations posted encouraging growth and commendable results in the half year under review, including the contribution of Genop, acquired on 1 January 2018. Each of the business units posted solid performance, achieving good growth in turnover, with disciplined cost control, yielding growth in trading profits across the board. The results were achieved against a background of a price-regulated environment, coupled with tough trading conditions, reflected in the continued pressure on the consumer due to the macro-economic environment. The Group's diversified portfolio remained resilient with growth in market share, with continued relentless focus on customer service and product quality.
Prospects
Trading conditions are expected to remain challenging, particularly in the Consumer and OTC environment. The low Single Exit Price (SEP) increases granted to the industry in March 2018 of 1.26% and 3.78% in the current calendar year, do not compensate for the above inflationary increases in salaries, wages and utilities. Against this background the Group is focused on improving its operational efficiency, growing the established brands and expanding its product range through the acquisition of non-regulated brands to defend its position in the market. Adcock Ingram is delighted it has been successful in winning a number of key products within the ARV tender and was awarded a 12% share of the overall tender, equating to approximately R1.8 billion (excluding VAT) to supply ARV drugs to state-run hospitals, over a period of three years, effective from 1 July 2019. Adcock Ingram?s share of the ARV Tender award over the three years includes 11% (16.8 million packs) of the 147 million packs of DLT requested in the tender, 2.8 million packs of other oral solid dosage products and 2.7 million bottles of oral solutions. As a member of Proudly South African, Adcock Ingram has its roots firmly entrenched in the South African market. We are proud to be a leading South African manufacturer, which has been recognised as a partner of the State in the national fight against HIV and AIDS. The tender award reflects positively on our manufacturing capability, breadth of our product offering and our historical service delivery levels.
Adcock Ingram (AIP) share price performance
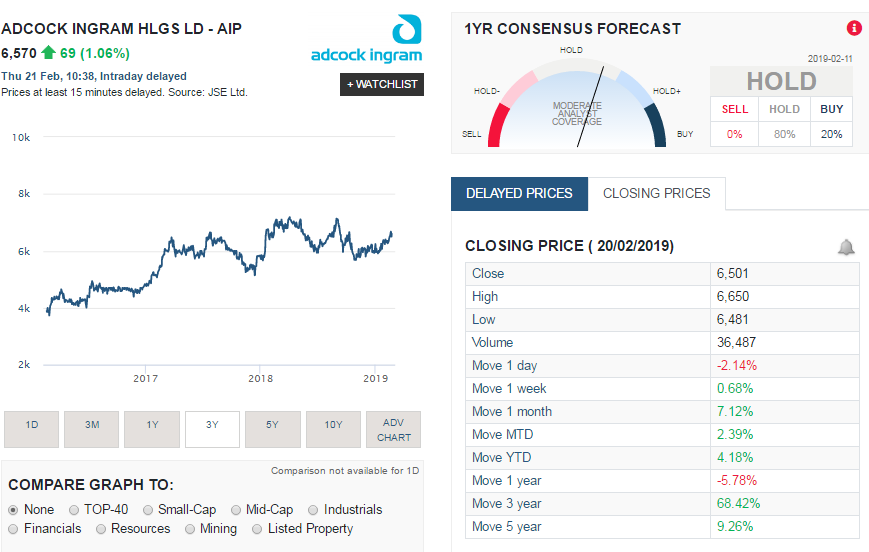
The screenshot of Adcock Ingram's share price performance taken from Sharenet below shows that AIP has been awarding shareholders handsomely (well at least those that bought the shares three years ago). A summary of AIP's share price performance in South Africa
- Last Week: 0.68%
- Month to Date (MTD) : 7.12%
- Year to Date (YTD): 4.18%
- 1 year move: -5.8%
- 3 year move: -68.42%
Adcock Ingram (AIP) share valuation
So what exactly are Adcock Ingram shares worth, based on their latest financial results, cash generation capabilities, PE ratio, dividend yield and net asset value? It is always hard to derive a value for a company. But those operating in defensive sectors such as the healthcare sector will always have demand for their products, there are high barriers to entry (not anyone can just start making drugs and sell it). Net profit margins are decent, the PE ratio is not to demanding and dividend payouts are growing nicely. Based on all of the above, our internal valuation model values AIP shares at: R75.95 a share. So we do believe at its current price (as at the time of writing the article, R65.70) offers good value for long term investors looking to buy shares in a defensive stock.