|
Related Topics |
|
We take a look at the Stock Exchange News Service (SENS) released by Woolworths which provides a sales update and voluntary trading statement for the period ending December 2019
|
|
About Woolworths
The first Woolworths store opened its doors to the public in Cape Town in October 1931. And it was founder Max Sonnenberg who captured the public’s imagination with dynamic store policies that set Woolworths apart from its competitors. Three years later, a second branch opened in Durban, with another two in Port Elizabeth and Johannesburg a year later. And since then we’ve been building on our reputation for superior quality, exciting innovation and excellent value.
Trading update and voluntary trading statement: 26 weeks ended 29 December 2019
TRADING UPDATE
Group sales for the 26 weeks ended 29 December 2019 (‘current period’) increased by 3.8% compared to the 26 weeks ended 23 December 2018 (‘prior period’) and by 4.6% in constant currency terms. As previously reported, the 2019 financial year had a 53 week year, which resulted in a shift in trading weeks in 2020 compared to the prior financial year.
This shift resulted in the Christmas week, including Boxing Day which is a significant trading day in Australia, falling into the first half of the current year compared to the second half of the prior year. In South Africa, the constrained economic environment, exacerbated by the disruption to trade caused by power outages and unseasonal weather in parts of the country, contributed to slower December trade. Woolworths Fashion, Beauty and Home (‘FBH’) sales and comparable store sales both grew by 2.2% and by 0.9% after adjusting for the shift in trading weeks. Price movement in Fashion categories was 4.0% and overall net space growth across FBH was 1.2%.
Woolworths Food sales increased by 8.1%, and by 7.8% after adjusting for the shift in trading weeks, with comparable store sales 5.4% higher and price movement of 5.1%. The business has maintained positive volume growth for the period and continues to grow market share. Net space growth was 4.0%.
The Woolworths Financial Services book reflected positive year-on-year growth of 8.3% as at the end of December 2019. The annualised impairment rate for the six months ended 31 December 2019 was 3.3% (six months ended 31 December 2018: 3.2%).
In Australia, David Jones sales for the period increased by 4.9% and were 0.5% lower after adjusting for the shift of the Christmas week. The disruption from the Elizabeth Street store refurbishment, due for completion in March 2020, has reduced, compared to the second half of last year, as additional floors have opened for trade. Comparable store sales (which include online) were 0.4% lower after adjusting for the trading week shift. Online sales grew by 61.8% and now comprise 10.4% of total sales. Net space increased by 1.2%. Country Road Group sales declined by 2.5%, and increased by 3.3% excluding the sales impact of the Myer exit. Comparable store sales (which include online) grew by 0.1% after adjusting for the shift in trading weeks. Online sales in Australasia grew by 6.2% and now represents 21.4% of total Australasia sales. As the contribution from online sales increases, the reduction of unproductive space remains a priority in David Jones and the Country Road Group. Net space in the Country Road Group reduced by 8.1%, which includes the space exited in Myer.
VOLUNTARY TRADING STATEMENT
This voluntary trading statement is issued in terms of Section 3.4 (b) of the JSE Listings Requirements. Shareholders are advised that earnings per share (‘EPS’), headline earnings per share (‘HEPS’) and adjusted diluted HEPS for the current period are impacted by the adoption of IFRS 16. EPS and HEPS are unlikely to differ by 20% or more than the previous corresponding period. The Group will be reporting on IFRS 16 for the first time in the interim financial results of the 2020 financial year on a modified retrospective approach, with no restatement of the reported comparative prior period results. Excluding the impact of IFRS 16, in both the current and prior periods, EPS, HEPS and adjusted diluted HEPS are expected to be within the ranges reflected in the table below:
December 2018 December 2019 December 2019
reported (cents) expected range (%) expected range (cents)
EPS 197.5 -7.5% to -12.5% 172.8 to 182.7
HEPS 200.4 -7.5% to -12.5% 175.4 to 185.4
Adjusted diluted HEPS 202.9 -9.0% to -14.0% 174.5 to 184.6
Including the impact of IFRS 16 in the current period, EPS, HEPS and adjusted diluted HEPS are expected to be within the ranges reflected in the table below:
December 2018 December 2019 December 2019
reported (cents) expected range (%) expected range (cents)
EPS 197.5 -15.0% to -20.0% 158.0 to 167.9
HEPS 200.4 -15.0% to -20.0% 160.3 to 170.3
Adjusted diluted HEPS 202.9 -17.5% to -22.5% 157.2 to 167.4
CONSTANT CURRENCY INFORMATION
The constant currency information contained in this announcement has been presented to illustrate the impact of changes in the Group’s major foreign currency, the Australian dollar. In determining the constant currency turnover and concession sales growth rate, turnover and concession sales denominated in Australian dollars for the current period have been adjusted by application of the aggregated monthly average Australian dollar exchange rate for the prior period. The foreign currency fluctuations of our rest of Africa operations are not considered material, and have therefore not been applied in determining the constant currency turnover and concession sales growth rate. The aggregated monthly average Australian dollar exchange rate is R10.05 for the current period and R10.26 for the prior period.
The constant currency information, which is the responsibility of the Group's directors, has been prepared for illustrative purposes only and may not fairly present the Group’s financial position, changes in equity, cash flows or results of operations. The information contained in this announcement, including voluntary estimated financial information and constant currency information, has not been reviewed or reported on by the Group’s external auditors. The Group’s interim financial results for the 26 weeks ended 29 December 2019 will be released on the Stock Exchange News Service on or about 20 February 2020.
Woolworths (WHL) stock price history
The image below shows the share price history of Woolworths over the last 5 years. And its not been a very good time for Woolworths shareholders with the stock having lost 43.86% of its value over the last 5 years. And based on the trading statement numbers above we suspect Woolies will drop today as the numbers reflect the continued struggle for the retail giant.
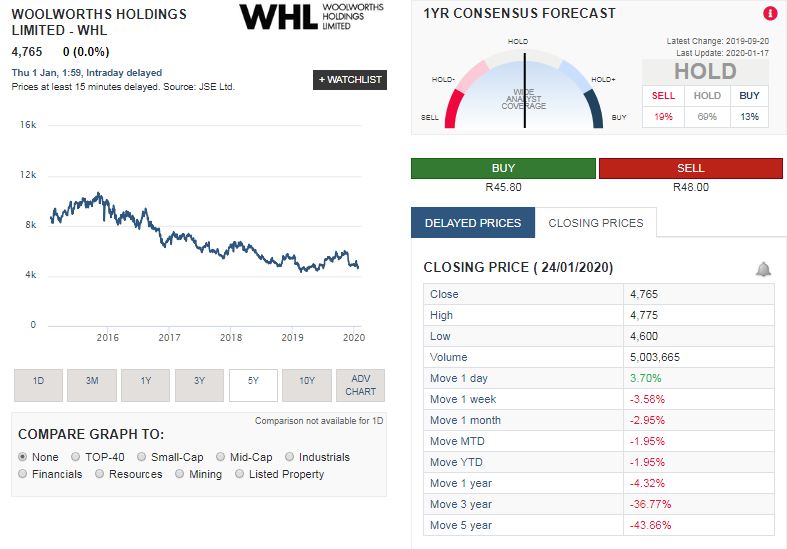
Woolworths stock price in for a hard time after the release of their latest trading statement
The summary below shows the returns provided to Woolworths shareholders over various time periods:
- 1 week: -3.58%
- 1 month: -2.95%
- 1 year: -4.32%
- 3 years: -36.77%
- 5 years: -43.86%