|
Related Topics |
|
In this article we take a look at the latest General Household Survey (GHS) and what it says about South African households and transport.
How many taxi trips or bus trips are undertaken by South Africans every month? Or what percentage of workers state it takes them more than 30 minutes to get to work? We take a look below. |

Train moving on the line
|
|
So in which province do the most taxi rides take place?
The table below provides data in various transport metrics based on the results of the latest General Household Survey (GHS) results as published by Statistics South Africa. We are particularly interested in the estimated number of passenger trips undertaken per province and per transport type. The below is summary of the number of minibus/taxi trips undertaken per month per province.
- Western Cape: 4 840 000
- Eastern Cape: 4 426 000
- Northern Cape: 680 000
- Free State: 2 386 000
- KwaZulu-Natal: 9 623 000
- North West: 3 117 000
- Gauteng: 22 350 000
- Mpumalanga: 3 220 000
- Limpopo: 3 567 000
- Total minibus/taxi trips for South Africans per month: 54 209 000
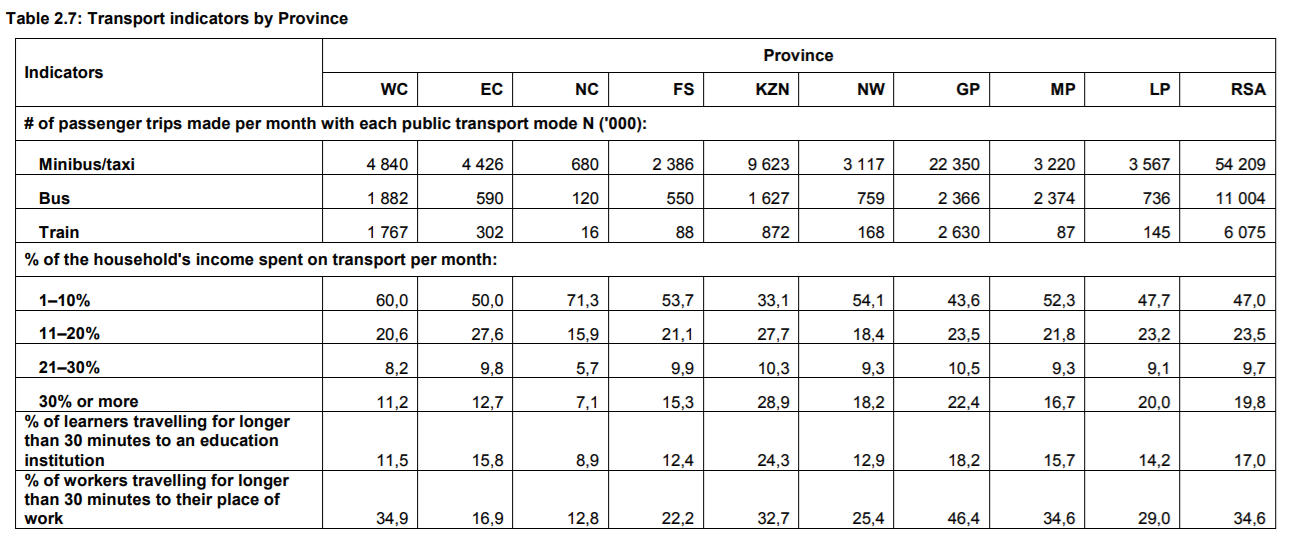
While minibus/taxi is the undisputed king of public transport trips, with it being 5 times greater in terms of number of trips undertaken by bus, it is 9 times greater than number of trips undertaken by train. So for every 1 passenger using a train for a trip, 9 people will be using a taxi for a trip. So how much money is spent on public transport by households? Well according to the GHS 47% of South African Households spend between 1 % and 10% of their income on public transport. And 23.5% of South African households reporting that they spend between 11% and 20% of their income on public transport. Below a breakdown per province of those households who reported spending between 1% and 10% of their income on public transport.
- Western Cape: 60%
- Eastern Cape:50%
- Northern Cape: 71.3%
- Free State: 53.7%
- KwaZulu-Natal: 33.1%
- North West: 54.1%
- Gauteng: 43.6%
- Mpumalanga: 52.3%
- Limpopo: 47.7%
- Total minibus/taxi trips for South Africans per month: 47%
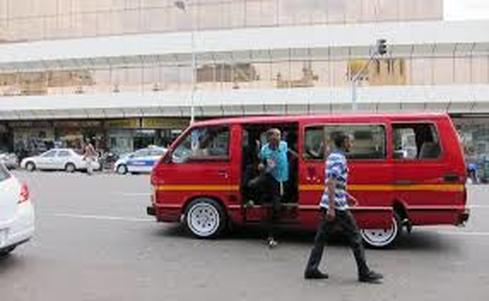
A scene many South Africans will recognize, a passenger getting out of a taxi in the middle of the road
Lastly we will take a look at the percentage of workers per province who reported that it takes them longer than 30 minutes to commute to their place of work. The summary below breaks it down per province:
- Western Cape: 34.9%
- Eastern Cape: 16.9%
- Northern Cape: 12.8%
- Free State: 22.2%
- KwaZulu-Natal: 32.7%
- North West: 25.4%
- Gauteng: 46.4%
- Mpumalanga: 34.6%
- Limpopo: 29%
- Total minibus/taxi trips for South Africans per month: 34.6%