South African Market Insights
  • Home
  • Blog
    • Blog-5Jun2018
    • Blog-18May2018
    • Blog-16May2018
    • Blog-3May2018
    • Blog-2May2018
    • Blog-30Apr2018
    • Blog-26Apr2018
    • Blog-24Apr2018
    • Blog-18Apr2018
    • Blog-17Apr2018
    • Blog-16Apr2018
    • Blog-3Apr2018
    • Blog-22Mar2018
    • Blog-20Mar2018
    • Blog-19Mar2018
    • Blog-23Oct2017
    • Blog-20Oct2017
    • Blog-11Oct2017
    • Blog-10Oct2017
    • Blog-6Oct2017
    • Blog-3Oct2017
    • Blog-2Oct2017
  • Economics
    • Rand Dollar Exchange Rate
    • South Africa's GDP
    • South Africa's Unemployment
    • SA by numbers
    • Economic Progress Index
    • Taylors Rule
    • South Africa's Formal Business Sector
    • South-Africa's-Fiscal-Policy
    • SA EU Trade Data
    • Inflation Heat Map
    • Population Density Map
    • Labour Market Dynamics
    • Estimating the Size of the Informal Economy
    • SA Consumer Spending Patterns
    • South Africa's Monetary Fiscal Policy Mix
    • GDP Animations >
      • SouthAfrica
      • WesternCape
      • EasternCape
      • NorthernCape
      • FreeState
      • KwaZuluNatal
      • NorthWest
      • Gauteng
      • Mpumalanga
      • Limpopo
    • South Africa's Economic Structure
    • South Africa's Economic History
    • South Africa's Trade Data Page
    • South Africa's Food and Beverages Sector
    • Financial Well-being of South African Companies_2015
    • SA vs the World
    • Budget Day Page (24 Feb 2016)
  • Stock in Focus
    • JSE ALSI Chart
    • Sector Comparison Page
    • JSE-Calendar-Tracker-2019
    • Adcorp (ADR)
    • Amazon (AMZN)
    • Apple (AAPL)
    • Ascendis (ASC)
    • AVI (AVI)
    • Bidvest (BVT)
    • Blue Label Telecoms (BLU)
    • Bowler Metcalf (BCF)
    • Capitec (CPI)
    • City Lodge Hotel Group
    • Clicks Group (CLS)
    • Coronation (CML)
    • Curro Holdings (COH)
    • Discovery (DSY)
    • Distell (DST)
    • EOH (EOH)
    • Famous Brands (FBR)
    • Ferrari (RACE)
    • FirstRand Group (FSR)
    • Grindrod (GND)
    • GrowthPoint (GRT)
    • Holdsport (HSP)
    • Harley-Davidson (HOG)
    • Hyprop (HYP)
    • Hyprop (HYP)_1Jun2016
    • Investec Property Fund (IPF)
    • JSE (JSE)
    • Massmart (MSM)
    • MediClinic (MEI)
    • MTN (MTN)
    • MTN (MTN)_May2016
    • Mr Price Group (MRP)
    • Mr Price Group (MRP)_8APR2016
    • Nedbank (NED)
    • OneLogix (OLG)
    • Peregrine Holdings (PGR)
    • Pick 'n Pay Stores (PIK)
    • Pioneer Foods (PFG)
    • PSG Group (PSG)
    • Quantum Foods (QFH)
    • RCL Foods (RCL)
    • Remgro (REM)
    • Richemont (CFR)
    • RMB Holdings (RMH)
    • Rolfes (RLF)
    • Sanlam (SLM)
    • Sasol (SOL)
    • Sasol (SOL)_18sep2016
    • Santova (SNV)
    • Spar Group (SPP)
    • Shoprite Holdings (SHP)
    • Spur Corporation (SUR)_7Sep2017
    • Standard Bank (SBK)
    • Steinhoff International Holdings (SNH)
    • Stor-Age (SSS)
    • Super Group (SPG)
    • Taste Holdings (TAS)_30May2016
    • The Foshini Group (TFG)
    • Value Logistics (VLE)
    • Vodacom (VOD)
    • Wilson Bayly Holmes Ovcon (WBO)
    • Woolworths (WHL)
    • Woolworths (WHL)_24Aug2017
    • Zeder (ZED)
  • Online Calculators
    • Rand Petrol Price Estimator
    • Share Valuation
    • Financial Ratios Calculator
    • GDP Growth Estimator
    • Future Value of Investment Calculator
    • Loan repayment calculator
  • Contact
  • About
  • Search

< South Africa's GDP
Economics Main Page >

South Africa's imports from and exports to Vietnam for November 2019

Category: International trade and  economics
​​​Date: 7 January 2020

Related Topics

We take a look at the latest merchandise trade statistics as published by SARS regarding the goods South Africa imports from Vietnam and the goods South Africa exports to Vietnam. Since our website shows an ever increasing number of people from Vietnam visiting our site we decided to look at international trade between Vietnam and South Africa
Golden Bridge in Vietnam
  • South Africa's Trade Data Page
  • South Africa's trade with Nigeria

South African exports to Vietnam

So what exactly is South Africa exporting to Nigeria, the biggest economy on the African continent? The summary below shows the main product categories and the total valued trader per category since the start of 2019 up to November 2019
  • Live animals:R 104 094 267
  • Vegetables: R 937 332 116
  • Animal or vegetable fats:  --
  • Prepared foodstuffs: R 81 482 036
  • Mineral Products: R 1 558 567 987
  • Chemicals: R 89 867 345
  • Plastics & Rubber: R 336 694 210
  • Raw hides & leather: R 121 870 356
  • Wood Products: R 60 139 827
  • Wood pulp & paper: R 12 763 737
  • Textiles: R 27 015 789
  • Footwear: R 55 585 772
  • Stone & Glass: -- 
  • Precious Metal: R 2 053 678
  • Products Iron & Steel: R 218 096 699
  • Machinery: R 37 597 785
  • Vehicles aircraft & vessels: R 439 449
  • Photographic & medical equipment: R 3 120 956
  • Toys & Sport apparel: R 217 493
  • Works of art: R 1 028 269
  • Other unclassified goods: R 1 349
  • Equipment Components :​--
  • Total:  R 3 647 969 120

Total Exports from South Africa to Nigeria from January 2019 to June  2019 amounted to R 3 647 969 120

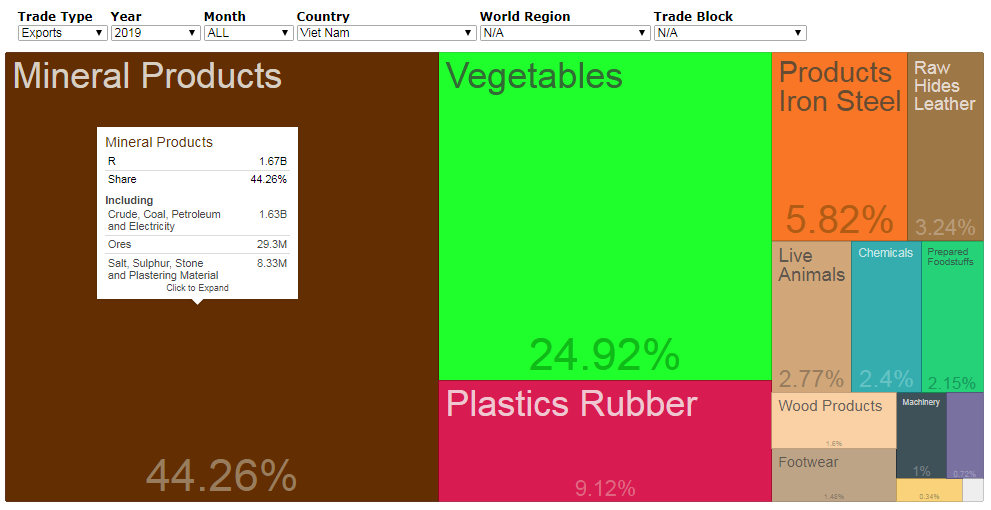
The tree chart below shows the main product exports to Vietnam for the months of January 2019 to November 2019 from South Africa. As can be seen the bulk of South Africa's exports to Vietnam is made up by mineral products and vegetables as these two product categories accounted for almost 70% of South Africa's exports to Vietnam from January 2019 to November 2019
South African exports to Vietnam
So what did South Africa import from Vietnam during the period January 2019 to November 2019? The summary below shows the imports from Vietnam per main product category :
  • Live animals: R 80 848 206
  • Vegetables: R 429 169 264
  • Animal or vegetable fats: R 427 036
  • Prepared foodstuffs: R 128 663 570
  • Mineral Products: R 733 687 145
  • Chemicals: R 241 451 898
  • Plastics & Rubber: R 173 096 071
  • Raw hides & leather: R 97 972 876
  • Wood Products: R 18 981 361
  • Wood pulp & paper: R 14 348 385
  • Textiles: R 583 913 672
  • Footwear: R 1 883 675 367
  • Stone & Glass: R 32 373 965
  • Precious Metal: R 26 188 410
  • Products Iron & Steel: R 184 488 004
  • Machinery: R 7 992 862 870
  • Vehicles aircraft & vessels: R 20 767 206
  • Photographic & medical equipment: R 90 228 638
  • Toys & Sport apparel: R 347 484 382
  • Works of art: R 422 190
  • Other unclassified goods: R 2 560 318
  • Equipment Components: R 112 948 933
  • Total: R 13 196 559 767
Total imports from Vietnam during the period January 2019 to June 2019: R13 196 559 767

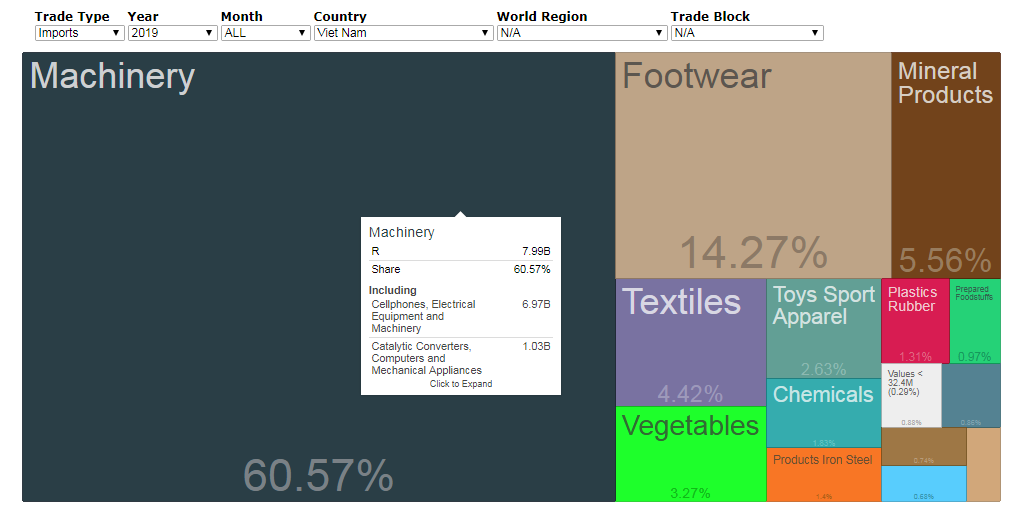
The tree map below shows the imports into South Africa from Vietnam for the months January 2019 to November 2019. The bulk of the imports into South Africa from Vietnam fulls under Machinery, with it accounting for over 60% of imports from Vietnam from January 2019 to November 2019. 
South African imports from Vietnam at product level
During the period January 2019 to November 2019 South Africa had a negative trade balance/ trade deficit with Vietnam to the value of -R9.548 billion. So South Africa exported R9.548 billion worth of goods to Vietnam than what it imported from Vietnam. It is not really surprising as a large number of Chinese firms manufacture goods in Vietnam and these goods are then exported to countries such as South Africa.

Newsletter Subscription:

    Please enter your email address below to subscribe to our newsletter. It will be ad hoc newsletters and we wont bombard your email inbox with emails. We will NEVER supply your contact details to any third party.

Subscribe to Newsletter

Additional content

Related Topics

  • South Africa's Trade Data Page
  • South Africa's trade with Nigeria​


​Homepage

Economics Page
Stock in Focus Page


​About


Contact Us

Copyright © 2015
  • Home
  • Blog
    • Blog-5Jun2018
    • Blog-18May2018
    • Blog-16May2018
    • Blog-3May2018
    • Blog-2May2018
    • Blog-30Apr2018
    • Blog-26Apr2018
    • Blog-24Apr2018
    • Blog-18Apr2018
    • Blog-17Apr2018
    • Blog-16Apr2018
    • Blog-3Apr2018
    • Blog-22Mar2018
    • Blog-20Mar2018
    • Blog-19Mar2018
    • Blog-23Oct2017
    • Blog-20Oct2017
    • Blog-11Oct2017
    • Blog-10Oct2017
    • Blog-6Oct2017
    • Blog-3Oct2017
    • Blog-2Oct2017
  • Economics
    • Rand Dollar Exchange Rate
    • South Africa's GDP
    • South Africa's Unemployment
    • SA by numbers
    • Economic Progress Index
    • Taylors Rule
    • South Africa's Formal Business Sector
    • South-Africa's-Fiscal-Policy
    • SA EU Trade Data
    • Inflation Heat Map
    • Population Density Map
    • Labour Market Dynamics
    • Estimating the Size of the Informal Economy
    • SA Consumer Spending Patterns
    • South Africa's Monetary Fiscal Policy Mix
    • GDP Animations >
      • SouthAfrica
      • WesternCape
      • EasternCape
      • NorthernCape
      • FreeState
      • KwaZuluNatal
      • NorthWest
      • Gauteng
      • Mpumalanga
      • Limpopo
    • South Africa's Economic Structure
    • South Africa's Economic History
    • South Africa's Trade Data Page
    • South Africa's Food and Beverages Sector
    • Financial Well-being of South African Companies_2015
    • SA vs the World
    • Budget Day Page (24 Feb 2016)
  • Stock in Focus
    • JSE ALSI Chart
    • Sector Comparison Page
    • JSE-Calendar-Tracker-2019
    • Adcorp (ADR)
    • Amazon (AMZN)
    • Apple (AAPL)
    • Ascendis (ASC)
    • AVI (AVI)
    • Bidvest (BVT)
    • Blue Label Telecoms (BLU)
    • Bowler Metcalf (BCF)
    • Capitec (CPI)
    • City Lodge Hotel Group
    • Clicks Group (CLS)
    • Coronation (CML)
    • Curro Holdings (COH)
    • Discovery (DSY)
    • Distell (DST)
    • EOH (EOH)
    • Famous Brands (FBR)
    • Ferrari (RACE)
    • FirstRand Group (FSR)
    • Grindrod (GND)
    • GrowthPoint (GRT)
    • Holdsport (HSP)
    • Harley-Davidson (HOG)
    • Hyprop (HYP)
    • Hyprop (HYP)_1Jun2016
    • Investec Property Fund (IPF)
    • JSE (JSE)
    • Massmart (MSM)
    • MediClinic (MEI)
    • MTN (MTN)
    • MTN (MTN)_May2016
    • Mr Price Group (MRP)
    • Mr Price Group (MRP)_8APR2016
    • Nedbank (NED)
    • OneLogix (OLG)
    • Peregrine Holdings (PGR)
    • Pick 'n Pay Stores (PIK)
    • Pioneer Foods (PFG)
    • PSG Group (PSG)
    • Quantum Foods (QFH)
    • RCL Foods (RCL)
    • Remgro (REM)
    • Richemont (CFR)
    • RMB Holdings (RMH)
    • Rolfes (RLF)
    • Sanlam (SLM)
    • Sasol (SOL)
    • Sasol (SOL)_18sep2016
    • Santova (SNV)
    • Spar Group (SPP)
    • Shoprite Holdings (SHP)
    • Spur Corporation (SUR)_7Sep2017
    • Standard Bank (SBK)
    • Steinhoff International Holdings (SNH)
    • Stor-Age (SSS)
    • Super Group (SPG)
    • Taste Holdings (TAS)_30May2016
    • The Foshini Group (TFG)
    • Value Logistics (VLE)
    • Vodacom (VOD)
    • Wilson Bayly Holmes Ovcon (WBO)
    • Woolworths (WHL)
    • Woolworths (WHL)_24Aug2017
    • Zeder (ZED)
  • Online Calculators
    • Rand Petrol Price Estimator
    • Share Valuation
    • Financial Ratios Calculator
    • GDP Growth Estimator
    • Future Value of Investment Calculator
    • Loan repayment calculator
  • Contact
  • About
  • Search