|
Related Topics |
|
We take a look at the latest banking sector information for October 2019 as published by the South African Reserve Bank (SARB). So are banks still impairing more and more of their loans and advances issued? And what is the profitability of South African Banks like?
|

|
So how many banks are there in South Africa as at October 2019?
Based on the data from the South African Reserve Bank (SARB) we can say the following about banks in South Africa:
Registered Banks: 19
Mutual Banks: 4
Co-operative Banks: 4
Local branches of foreign Banks: 16
Foreign Banks with approved local representative offices: 30
So what do these banks balance sheets look like and how does it compare to a year ago?
Registered Banks: 19
Mutual Banks: 4
Co-operative Banks: 4
Local branches of foreign Banks: 16
Foreign Banks with approved local representative offices: 30
So what do these banks balance sheets look like and how does it compare to a year ago?
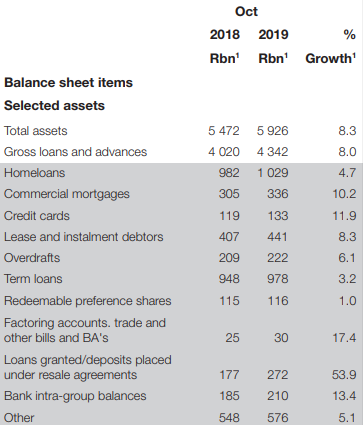
Total assets of banks in South Africa amounted to R5.926 trillion in October 2019 , up from R5.472 trillion in October 2018. This equated to growth of 8.3% in total assets for banks in South Africa. Gross loans and advances came in at R4.342 trillion in October 2019, up from R4.020 trillion in October 2018, which is growth of 8.0% year on year.
This is pretty strong and aggressive growth in the gross loans and advances. So in which category of gross loans and advances did the strongest growth take place over the last 12 months?
This is pretty strong and aggressive growth in the gross loans and advances. So in which category of gross loans and advances did the strongest growth take place over the last 12 months?
- Home loans: 4.7% growth to R1.029 trillion
- Commercial mortgages: 10.2% growth to R336 billion
- Credit cards: 11.9% growth to R138 billion (jip South Africans owe R138 billion on credit cards)
- Lease and instalment debtors: 8.3% growth to R441 billion
- Overdrafts: 6.1% growth to R222 billion (so South African's are using R222 billion worth of overdraft facilities)
- Term loans: 3.2% growth to R978 billion (mostly short term and personal loans being taken on). This is a massive amount of money but the year on year growth in this category is substantially lower than some of the other lending categories which to us is a sign that banks are becoming less keen on offering loans that are not backed by some form of asset
So what about the South African banks profitability? The image below provides various ratios such as return on equity and return on assets for South African Banks
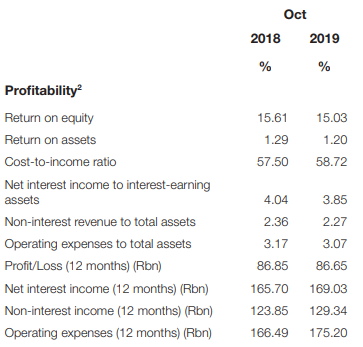
Return on equity of South African banks decline from October 2018 to October 2019 with it falling from 15.61% to 15.03%. Return on assets declined from 1.29% to 1.20%. Cost pressures are also starting to manifest as the cost t-to-income ratio increased from 57.50% to 58.72% from October 2018 to October 2019. Net interest income earned by banks in October 2019 amounted to R169.03 billion.
While non interest income of South African banks amounted to R129.34 billion in October 2019. So basically banks earn the bulk of their income from charging interest on loans, with banking and admin and other fees charged by banks making up 42.2% of total income earned while 57.8% of income earned from banks in South Africa comes from interest. But its not only sunshine and roses for South African banks. South African consumers are starting to default more and more on their loans and it shows with the impairments banks are making.
While non interest income of South African banks amounted to R129.34 billion in October 2019. So basically banks earn the bulk of their income from charging interest on loans, with banking and admin and other fees charged by banks making up 42.2% of total income earned while 57.8% of income earned from banks in South Africa comes from interest. But its not only sunshine and roses for South African banks. South African consumers are starting to default more and more on their loans and it shows with the impairments banks are making.
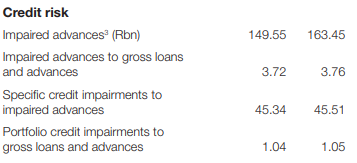
In total South African banks wrote off or impaired loans that have been advanced to the value of R163.45 billion during October 2019. This is an increase of 9.29% on the R149.55 billion that was impaired by banks during October 2018. Impairments are growing a faster rate than the new gross loans and advances that are being issued.
And this will affect banks balance sheets and their overall profitability. Currently as at October 2019, 3.76% of all loans and advances made by South African banks are being impaired (or written off). This is up from 3.72% a year ago. If banks, South Africans, government and the South African Reserve Bank needed a sign that South African consumers are really struggling this is it.
South Africans are struggling to pay back and service all their debt. And South Africa needs a more expansionary or accommodating monetary policy, not only to assist ailing South Africa consumers but to give South Africa's economy a desperately needed boost. A tiny 25 basis point cut wont help at all, we need significant action if we want to see monetary policy assist the South African economy in growing. And with inflation at its current levels the monetary policy can be relaxed to be more accommodative to economic growth.