|
Related Topics |
|
In this update we take a look at the latest trading update published by SASOL. And the market is not liking what SASOL has to say in their latest trading update. The price is down 5.9% since the updated trading statement.
|
|
Lake Charles EBITDA revised from $110 million profit to EBITDA loss of -$165 million
Shareholders of Sasol are referred to the Company’s trading statement released on the Stock Exchange News Service (SENS) on 21 November 2018 (Announcement), wherein the Company indicated that an updated trading statement will be released on SENS in January 2019, once reasonable certainty is attained with regards to the 31 December 2018 half-year financial results.
We have now reached a reasonable degree of certainty that the financial performance for the six months ended 31 December 2018 (half year 2019) is expected to be within the updated earnings ranges contained in the table below. Core headline earnings per share (Core HEPS) and earnings before interest, tax, depreciation and amortisation (EBITDA) are within the previously provided range as outlined in the Announcement. However, we are revising the range slightly upwards with regards to earnings per share (EPS) and headline earnings per share (HEPS). The main reason for the increase is the impact of half year-end valuation adjustments associated with crude oil hedges and closing exchange rates. The updated ranges can be summarised as follows:
Estimated Actual Expected
Half year 2019 Half year 2018 % change
EPS R23,71 – R24,16 R11,29 110% – 114%
HEPS R22,97 – R23,68 R17,67 30% – 34%
Core HEPS R21,14 – R21,86 R18,22 16% – 20%
EBITDA R26 billion – R28 billion R24,2 billion 8% – 16%
Key macro-economic summary
Half year Half year %
2019 2018 change
Rand/US dollar average exchange rate 14,20 13,40 6
Rand/US dollar closing exchange rate 14,36 12,37 16
Average dated Brent crude oil price (US dollar / barrel) 71,33 56,74 26
Refining margins (US dollar / barrel) 9,49 9,73 (2)
Average Henry Hub gas price (US dollar / million British thermal unit) 3,36 2,93 15
The increase/(decrease) from HEPS to Core HEPS is as follows:
2019 2018
Translation impact of closing exchange rate (0,51) 1,33
Mark-to-market valuation of oil and foreign exchange hedges (0,48) (0,78)
Implementation of Khanyisa B-BBEE transaction 0,63 –
Reversal of provision for tax litigation matters (1,60) –
Lake Charles Chemicals Project (LCCP) depreciation (post Beneficial Operation ramp-up) 0,17 –
Cost
The normalised cash fixed cost for the period under review has been contained to below our 6% inflation target despite operational challenges experienced during the period.
LCCP update
As at the end of December 2018, engineering and procurement activities were substantially complete and construction progress was at 84%. Our overall project completion was 94% and capital expenditure amounted to US$10,9 billion.
The first derivative unit, linear low-density polyethylene (LLDPE), produced first product in January 2019and beneficial operation is expected in February, approximately two months behind schedule. Utilitiesto support the early process units were fully operational by end November 2018. These utilities together with LLDPE will comprise ~40% of the LCCP existing total cost.
Unfortunately, during the last quarter of CY2018, several factors within and beyond our control impacted the completion schedule and associated cost for the remaining units resulting in the overall project capital cost estimate being revised from US$11,13 billion to a range of US$11,6 – 11,8 billion. The difference between the upper end and lower end of the range represents a contingency and weather provision of US$200 million.
These factors which impacted the revised cost estimate include:
Changes to scope
Productivity losses exacerbated by high absenteeism around public holidays and construction rework since end November 2018; and Schedule delays of the remaining units will result in additional overhead costs.
While our underlying productivity factor remained on track, the inclement weather, scope additions and absenteeism had a significant impact on actual productivity. These factors were assessed and quantified late in Q4 CY2018 and where feasible, management interventions were put in place to arrest the controllable trends. Unfortunately, the mitigating actions were not successful in reversing the full impact on schedule and cost.
Management maintains our unrelenting focus on delivering the remaining units per this updated plan and we remain confident that the fundamentals for the LCCP – being, among others, a feedstock advantaged plant, a world scale highly integrated facility, diverse product slate with high margin products and world class logistics and infrastructure – remain intact. As a result of the delays highlighted above, we are revising our LCCP EBITDA estimate down from US$110 – US$160 million to an EBITDA loss of US$165 – US$195 million for FY19. However, we maintain our guidance that LCCP will deliver a steady state EBITDA of US$1,3 billion in FY2022.
We have now reached a reasonable degree of certainty that the financial performance for the six months ended 31 December 2018 (half year 2019) is expected to be within the updated earnings ranges contained in the table below. Core headline earnings per share (Core HEPS) and earnings before interest, tax, depreciation and amortisation (EBITDA) are within the previously provided range as outlined in the Announcement. However, we are revising the range slightly upwards with regards to earnings per share (EPS) and headline earnings per share (HEPS). The main reason for the increase is the impact of half year-end valuation adjustments associated with crude oil hedges and closing exchange rates. The updated ranges can be summarised as follows:
Estimated Actual Expected
Half year 2019 Half year 2018 % change
EPS R23,71 – R24,16 R11,29 110% – 114%
HEPS R22,97 – R23,68 R17,67 30% – 34%
Core HEPS R21,14 – R21,86 R18,22 16% – 20%
EBITDA R26 billion – R28 billion R24,2 billion 8% – 16%
Key macro-economic summary
Half year Half year %
2019 2018 change
Rand/US dollar average exchange rate 14,20 13,40 6
Rand/US dollar closing exchange rate 14,36 12,37 16
Average dated Brent crude oil price (US dollar / barrel) 71,33 56,74 26
Refining margins (US dollar / barrel) 9,49 9,73 (2)
Average Henry Hub gas price (US dollar / million British thermal unit) 3,36 2,93 15
The increase/(decrease) from HEPS to Core HEPS is as follows:
2019 2018
Translation impact of closing exchange rate (0,51) 1,33
Mark-to-market valuation of oil and foreign exchange hedges (0,48) (0,78)
Implementation of Khanyisa B-BBEE transaction 0,63 –
Reversal of provision for tax litigation matters (1,60) –
Lake Charles Chemicals Project (LCCP) depreciation (post Beneficial Operation ramp-up) 0,17 –
Cost
The normalised cash fixed cost for the period under review has been contained to below our 6% inflation target despite operational challenges experienced during the period.
LCCP update
As at the end of December 2018, engineering and procurement activities were substantially complete and construction progress was at 84%. Our overall project completion was 94% and capital expenditure amounted to US$10,9 billion.
The first derivative unit, linear low-density polyethylene (LLDPE), produced first product in January 2019and beneficial operation is expected in February, approximately two months behind schedule. Utilitiesto support the early process units were fully operational by end November 2018. These utilities together with LLDPE will comprise ~40% of the LCCP existing total cost.
Unfortunately, during the last quarter of CY2018, several factors within and beyond our control impacted the completion schedule and associated cost for the remaining units resulting in the overall project capital cost estimate being revised from US$11,13 billion to a range of US$11,6 – 11,8 billion. The difference between the upper end and lower end of the range represents a contingency and weather provision of US$200 million.
These factors which impacted the revised cost estimate include:
Changes to scope
- Late scope additions for the Cracker as a result of incomplete engineering work not timeously identified;
- Increased scope to ensure process safety for the Cracker and Ethylene oxide / Ethylene Glycol (EO/EG) unit due to defective carbon steel forgings. The impact was fully assessed late in Q4 CY2018 leading to a one month delay;
Productivity losses exacerbated by high absenteeism around public holidays and construction rework since end November 2018; and Schedule delays of the remaining units will result in additional overhead costs.
While our underlying productivity factor remained on track, the inclement weather, scope additions and absenteeism had a significant impact on actual productivity. These factors were assessed and quantified late in Q4 CY2018 and where feasible, management interventions were put in place to arrest the controllable trends. Unfortunately, the mitigating actions were not successful in reversing the full impact on schedule and cost.
Management maintains our unrelenting focus on delivering the remaining units per this updated plan and we remain confident that the fundamentals for the LCCP – being, among others, a feedstock advantaged plant, a world scale highly integrated facility, diverse product slate with high margin products and world class logistics and infrastructure – remain intact. As a result of the delays highlighted above, we are revising our LCCP EBITDA estimate down from US$110 – US$160 million to an EBITDA loss of US$165 – US$195 million for FY19. However, we maintain our guidance that LCCP will deliver a steady state EBITDA of US$1,3 billion in FY2022.
Share price performance after the Lake Charles EBITDA loss announcement?
The image below is a screenshot taken from Moneyweb, showing SASOL's intraday reaction to the SENS announcement in which it stated from expecting a EBITDA profit of around $110 million from the Lake Charles Chemicals Project (LCCP) they now expect a loss of around -$165 million.
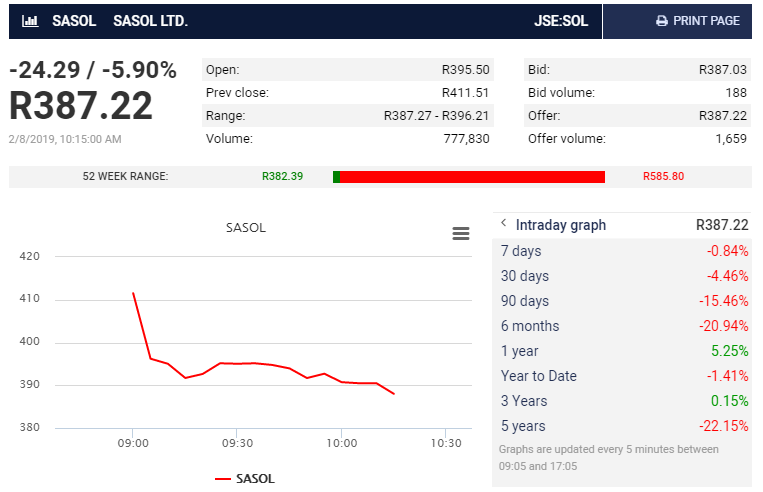
SASOL (SOL) share price getting hammered after Lake Charles Chemicals project problems leads to EBITDA losses at project of at least $165mil
In Rand terms from expecting LCCP to contribute R1.4 billion to pre tax and pre depreciation profits it now expects to lose R2.2 billion on the project. That is a R3.6 billion swing in SASOL's guidance on LCCP. No surprise that the market is giving them a hiding