|
Related Topics |
|
We take a look at wage inflation in South Africa across various major sectors of the South African economy. Does the wage inflation of the mining industry track that of retail, or wage inflation of government track the wage inflation of the manufacturing sector? We take look at the wage inflation trends for various sectors of the South African economy below.
|
Image obtained from TravelStart
|
Lets start be estimating estimated wages per employee per industry
We start of by using data obtained from Statistics South Africa (Stats SA) and their quarterly employment statistics survey (QES), which collects data on the number of employees in the formal non agricultural economy of South Africa as well as collecting pay roll information of such employees such as salaries and wages, bonuses and overtime etc.
The total gross earnings (salaries and wages etc before taxes) per sector were divided by the total number of employees in each of these sectors in order to get an estimated total gross earnings per employee per sector. This was then calculated over various quarters in order to build a time series of estimated average wage per employee per sector per quarter. The relevant quarters where then compared with one another in order to derive an estimated year on year growth rate in average earnings per employee per sector (which serves as our proxy for wage inflation). So for example the average earnings per employee in the mining industry in quarter 1 of 2019 was compared to the average earnings per employee in the mining industry in quarter 1 of 2018. From there the year on year growth rates per sector per quarter was calculated to build the time series.
The total gross earnings (salaries and wages etc before taxes) per sector were divided by the total number of employees in each of these sectors in order to get an estimated total gross earnings per employee per sector. This was then calculated over various quarters in order to build a time series of estimated average wage per employee per sector per quarter. The relevant quarters where then compared with one another in order to derive an estimated year on year growth rate in average earnings per employee per sector (which serves as our proxy for wage inflation). So for example the average earnings per employee in the mining industry in quarter 1 of 2019 was compared to the average earnings per employee in the mining industry in quarter 1 of 2018. From there the year on year growth rates per sector per quarter was calculated to build the time series.
Advertisement
So what was the average wage per sector as at September 2019 in South Africa?
The summary below shows the average gross monthly earnings per sector in the South Africa economy as at the end of September 2019.
So the stand out number is that of electricity, gas and water supply. Well surprise surprise the main reason for this is ESKOM, with everyone there looking to milk the struggling state owned enterprise for all its worth. And we know the group is know for paying excessive salaries, overtime, bonuses and other benefits that are totally un derserved from staff at ESKOM. The graphic below shows the year on year wage inflation rates of teh various sectors of South Africa's calculated over various quarters.
- Mining and quarrying: R79 767
- Manufacturing: R59 462
- Electricity, gas and water supply: R136 755
- Construction: R51 017
- Wholesale, retail and motor trade; hotels and restaurants: R45 608
- Transport, storage and communication: R82 283
- Financial intermediation, insurance, real estate and business services: R79 418
- Community, social and personal services: R 86 061
So the stand out number is that of electricity, gas and water supply. Well surprise surprise the main reason for this is ESKOM, with everyone there looking to milk the struggling state owned enterprise for all its worth. And we know the group is know for paying excessive salaries, overtime, bonuses and other benefits that are totally un derserved from staff at ESKOM. The graphic below shows the year on year wage inflation rates of teh various sectors of South Africa's calculated over various quarters.
The graphic above does seem rather messy and busy, but what readers will notice immediately is the downward trend in the year on year percentage changes in wage inflation of almost all sectors of the South African economy over time. We would however like to highlight three sectors which is manufacturing, trade (retail, wholesale and motor trade) and construction. These are 3 sectors that have been under severe pressure in South Africa for a prolonged period of time, but for different reasons.
Manufacturing in South Africa has been struggling due to the continued growth of imports of manufactured goods into South Africa from countries such as China, USA, Germany, South Korea etc.
Trade has been struggling due to consumers being overtaxed by government and the unemployment rate rising continually. Pair this with consumers taking on more and more debt and struggling to pay back said debt, it has left a large number of consumers out of pocket which affects the income earned by the retail, wholesale and motor trade industries.
And the construction industry in South Africa has been in a slump for years. Long gone are the haydays before the 2010 Soccer World Cup when the construction industry was booming and government and the private sector spent buildings on new infrastructure and buildings and other fixed assets. Now there is little to no private sector investments into fixed assets in South Africa, largely due to sluggish economic growth and silly policy choices and positions such as expropriation of land without compensation. Which offshore business in their right mind would invest large sums of money in assets and on land in a country where the government looks to implement policies to take such land without compensation.
The current economic woes in South Africa is totally self inflicted by the South African government and the image below shows the impact the weak economy and poor policy choices have had on the wage inflation of the three sectors discussed above.
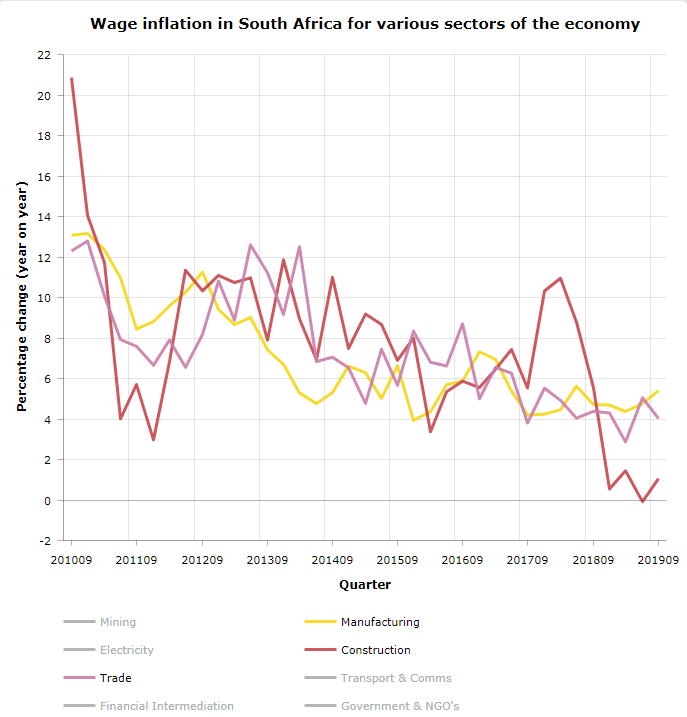
The image above clearly highlights the decline in the annual growth in average earnings per employee in the trade, manufacturing and construction industries in South Africa. The growth in the annual earnings of these sectors barely manage to outstrip the annual consumer inflation rate, which basically means all earnings growth benefits is eroded by higher prices paid for consumer goods. So while wage growth dwindles and consumer inflation remains, what is happening is that those employed are no better off than they were a year ago, and in some cases they are worse off as the growth in their wages is less than that of inflation which means their buying power actually decreased compared to a year ago.
It is tough going in the South African economy and it doesnt look like it will get better any time soon.
It is tough going in the South African economy and it doesnt look like it will get better any time soon.