|
Related Topics |
|
We take a look at the interim results for the period ending end of September 2018 of listed cellular operator Vodacom.
|
|
About Vodacom
So to those who dont know anything about Vodacom. Below a few details about the group.
Vodacom is a leading African mobile communications company providing a wide range of communication services, including mobile voice, messaging, data and converged services to over 103 million customers (including Safaricom). From our roots in South Africa, we have grown our mobile network business to include operations in Tanzania, the DRC, Mozambique, Lesotho and Kenya. Our mobile networks cover a population of over 284 million people. Through Vodacom Business Africa (VBA), we offer business managed services to enterprises in 32 countries. Vodacom is majority owned by Vodafone (64.5% holding), one of the world’s largest communications companies by revenue.
We have over 103 million customers on many different devices connected to our world-class networks, serviced through our various distribution and service partners. Our core services are voice, messaging and data, which are all available on either contract or prepaid. Contract gives you the convenience of paying for services after you've used them via monthly debit order, whereas prepaid lets you control how much you spend upfront without being locked into a contract. Our ultra-low-cost handsets ('ULCHs') make it affordable for everyone to get connected. Our products and services keep you connected in whatever way you choose. Whether through a phone call, SMS, email, tweet or status update - or even sending someone money - we are there to make it possible. It's all about helping you get more out of a connected world.
According to the group they have 44 089 000 customers in South Africa, which reflects growth of 10.2% from the last year. Currently there are 19 107 000 smart devices using their sim cards, which is growth of 10.5% over the last year
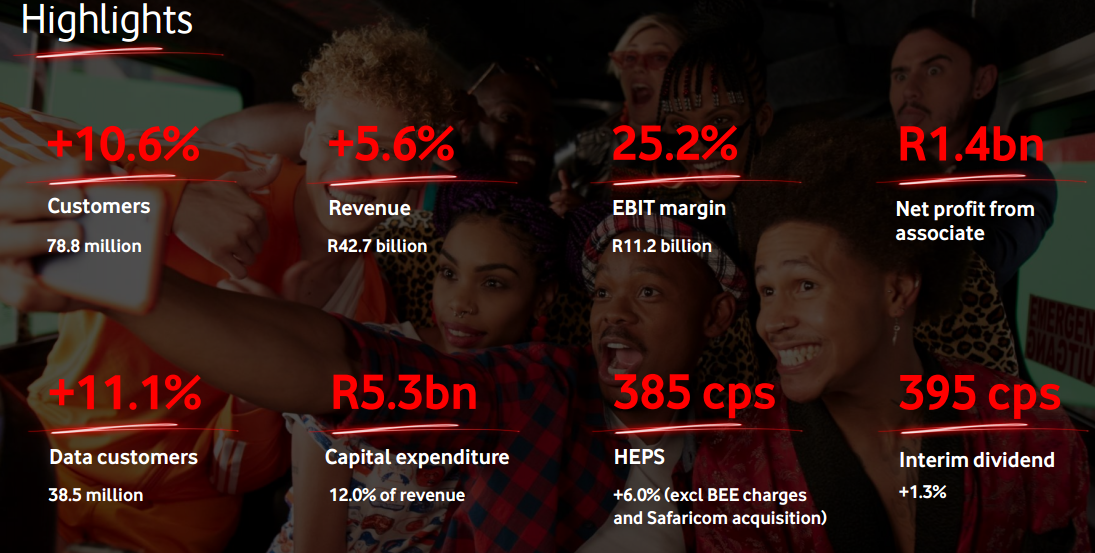
Vodacom Results Highlights
We provide our customers with the technology to engage with their worlds through handsets that are serviced through our various distribution and service partners.
There are many Contract, Top up and Prepaid plans, and ultra-low-cost handsets offering core services like voice, messaging and data:
There are many Contract, Top up and Prepaid plans, and ultra-low-cost handsets offering core services like voice, messaging and data:
- Contract - enjoy the benefit of only paying for services after use via debit orders
- Prepaid - enjoy being able to control how much you spend upfront.
So to the numbers we go
Below the results highlights as published by the group.
- Group service revenue up 6.1% (5.8%) to R36.8 billion; and Group revenue increased 5.6% (5.4%) to R44.4 billion
- We added 4.8 million customers in the six months, up 10.7%, comprising 2.5 million in South Africa and 2.3 million in our International operations.
- Safaricom added 373 000 customers. In combination, we now serve over 109 million customers across the Group.
- South Africa service revenue increased 4.6% to R27.9 billion#, supported by strong customer growth. International operations service revenue growth accelerated to 12.8% (11.4%), boosted by strong growth in data and M-Pesa.
- Group EBIT improved 3.4% (2.8%) to R11.2 billion, with strong improvement in our International operations.
- Significant capital investment of R5.3 billion to expand our coverage and improve the quality of our networks.
- Vodacom Lesotho, the first operator to launch a commercial 5G network in Africa.
- Concluded our new Broad-based black economic empowerment (BEE) ownership deal, the largest deal of its kind in the ICT sector.
- Safaricom contributed R1.4 billion profit, after deducting the amortisation of fair valued assets and before minority interest.
- Interim dividend per share of 395 cents, improved, despite issue of 114.5 million new shares for new BEE structure.
So any comments from management on the results?
The following extracts were taken from Vodacom's financial results as published earlier today.
"Following on from last year's extraordinary year for Vodacom, we delivered two strategic milestones during the first half of this year. In September, we concluded our second BEE transaction under the YeboYethu umbrella to replace the highly successful R7.5 billion deal launched in 2008. Valued at R16.4 billion, the new scheme is the biggest ever in the Telecommunications industry in South Africa and makes YeboYethu our third largest shareholder. As expected, the costs associated with this transaction had a once-off impact on headline earnings per share. Excluding the charges relating to the BEE transaction and contribution from Safaricom, HEPS rose 6.0%~
To facilitate the new BEE structure, we issued an additional 114.5 million shares yet increased our interim dividend to 395cps. In September, Vodacom Lesotho became the first company to commercially launch 5G on the African continent. This makes Vodacom Lesotho amongst the first in the world to lay claim to this innovation, paving the way for our other operations to follow suit once we secure the requisite spectrum. Over 5 million customers joined the Vodacom and Safaricom networks, increasing the combined customer base to 109 million. This shows that our strategy of sustained and targeted investment in customer and network experience across our operations is delivering strong results, contributing to the 5.8%* growth in service revenue across the Group. In South Africa, underlying growth has weakened as the country's economic slowdown increasingly weighs on consumer spending in the market. Still, service revenue rose 4.6% as anticipatory measures driven by the use of Big Data machine learning in more areas of the business has contributed to countering some of these pressures.
The 2.5 million increase in customers in South Africa since March, shows that our sustained effort to deliver greater value is working across prepaid and contract and is evidence that our personalisation through Big Data is delivering results. We invested R4 billion in South Africa alone in the past six months and at the same time we reduced effective voice and data prices by 8.5% and 16.4% respectively. We continue to accelerate our rural coverage expansion programme to bridge the digital divide and will prioritise an additional 200 villages this year to add to the 101 communities that we connected during the first quarter of this year. Mozambique produced an excellent performance while the momentum from our commercial actions in Tanzania and DRC last year continues to gather pace. This contributed to the strong performance in our International portfolio where normalised service revenue grew 11.4%*, led by rising customer numbers, accelerating demand for data and improved growth in M-Pesa. "
"The contribution to the Group by our mobile money platform continues to improve. The combined customer base, including Safaricom, grew 13.7% to 34.2 million. In our International operations, we processed M-Pesa transactions worth USD14 billion, supporting a 25.2% increase in revenue to R1.4 billion. M-Pesa now supports 21 million Safaricom customers, an increase of 8.8%, and M-Pesa now constitutes nearly one-third of its service revenues. Our strategic investment in Safaricom, concluded in the previous financial year, is exceeding our expectations having contributed R1.4 billion to the Vodacom Group's operating profit. Safaricom reported a 7.7% increase in service revenue and an 18.7% rise in EBIT. Looking ahead, the relative economic and currency stability in most of our International markets is pleasing and we will continue to invest heavily in our networks, artificial intelligence and Big Data analytics to drive financial inclusion, further enhance customer experience and progress Vodacom's digital telco strategy.
I am pleased that Telkom has selected Vodacom as its new roaming partner, and we look forward to delivery on this long-term mutually beneficial agreement. Apart from the commercial benefit, this partnership will also result in cost savings for Vodacom. Efforts to reduce the cost to communicate are contingent on having access to the right spectrum at reasonable market- related prices. While we are encouraged by the significant progress in recent times regarding the licensing of 4G spectrum in South Africa, there are still a number of areas of concern with the current draft Electronic Communications Act as well as inconsistencies in the proposed policy and policy directions to ICASA on licensing unassigned high demand spectrum. We remain committed to engaging with relevant stakeholders to find a suitable outcome to move South Africa forward."
A few numbers we would like to highlight:
- South Africa's total revenue: R35.3 billion (up 4.3%)
- South Africa's service revenue: 27.9 billion (up 4.6%)
- South Africa's data revenue: R12.2 billion (up 7.5%) . Data usage revenue is growing at rates a lot faster than their services revenue. And this category now makes up around a third of Vodacom's total revenue
- Headline earnings per share: R3.87 (which puts the group on a foward PE ratio of 17.6)
- Interim dividend yield: R3.95 (which places the group on a dividend yield of 6.06%)
- Net profit margin: 15.9%
- Cash generated per share: R7.22
Vodacom share price history
The graphic below shows Vodacom's share price over the last 4 years. Note the standard graphic shows the returns for the last year. Readers can drag the scroll bar at the top of the graphic to determine the date span of the graphic. The graphic will then recalculate the return of Vodacom shares for the given time period. Over the last year Vodacom has lost around 15% of its value.
Percent change: