|
|
Related Topics |
About Tiger Brands
Tiger Brands Limited, a Top 40 JSE Limited company whose footprint extends across the African continent and beyond, is one of the largest manufacturers and marketers of FMCG products in Southern Africa, and has been for several decades. Tiger Brands has been built over many decades through the acquisition and clustering of businesses. Our strategy for success comes from the perpetual renovation and innovation of our brands, while our approach to expansion, acquisitions and joint ventures has given traction to a distribution network that now spans more than 22 African countries. Our group focus is on the core business of FMCG categories that spread across the value chain. Our wide range of brands are underpinned by comprehensive research and meaningful insights into each of the markets in which Tiger Brands operates. Tiger Brands is a world–class operation – and will continue to hold and grow its position through constant investment in every asset of the business, be it in people, brands, technology, efficiency, quality or sustainability.
The groups brands include but are not limited to the following:
The image below shows Tiger Brands footprint across the African continent and the rest of the world.
The groups brands include but are not limited to the following:
- Energade
- Oros
- Tastic
- Koo
- Purity
- All Gold
- Beacon
- King Korn
- Ace
- All Sorts
- Jelly Tots
- Albany
- Golden Cloud
- Jungle Oats
- Enterprise (The cause of Listeriosis in South Africa)
- Bokkie
- Black Cat
- Maynards
- Fizzer
- Toff-o-luxe
The image below shows Tiger Brands footprint across the African continent and the rest of the world.
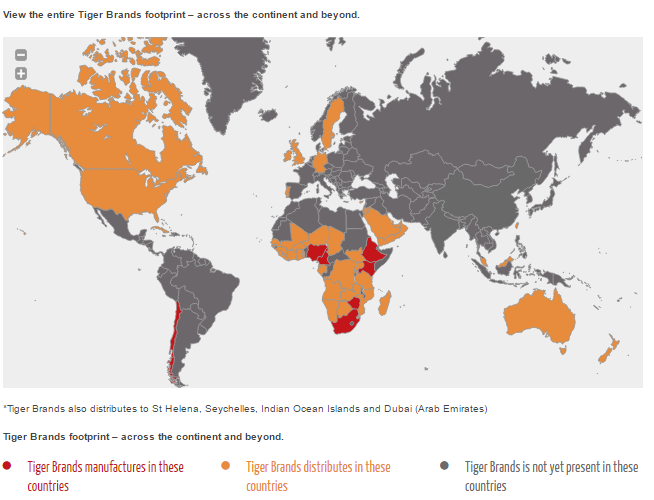
Tiger Brands Global Footprint
Financial results
The following was published on the JSE Security Exchange News Syteme (SENS) system earlier today
- Revenue declined by 9% to R28,5 billion
- Group operating income declined by 28% to R3,3 billion
- Group operating margin down 310bps to 11,7%
- Headline Eearnings Per Share (HEPS) down 26% to R15.87 per share (placing the group on a PE ratio of 17.1
- Dividend unchanged at R10.80 per share (placing the group on a dividend yield of 3.9%)
- Dividend cover reduced to 1,75x based on HEPS. So TBS will be paying out greater dividends in future with the reduction in the dividend cover.
- Oceana Group Limited (Oceana) stake to be unbundled
- Cash generated from operations: R3.3 billion (or R17.40 a share)
- Cash and equivalents on the balance sheet: R1.581 billion (or R8.32 a share)
- Inventories: R5 billion (up 5.2% from R4.81 billion in prior year)
- Trade and other receivables: R4.11 billion (down 14.4% from R4.81 billion in prior year). This is a good sign for TBS. Shows they managing funds outstanding to them. In fact they actually reduced amounts owning to them by almost 15%
- Group equity R17.4 billion (or around R94 a share).
So it is clear from the revenue numbers and the headline earnings per share numbers above that its been a tough year for the group. Massive recalls and fears regarding listeria ensured a lot of people do not buy the products that TigerBrands sold. So this contributed to part of the revenue and profit declines. But harsh economic times has certainly played its part. But dont take our word for it. Below Tiger Brands's management discusses the economic conditions and the stopping production of their Value added meat products (VAMP) due to listeriosis outbreak.
Management commentary on the financial results
Tiger Brands' results reflect the depressed consumer environment, which deteriorated further in the second half of the year. South Africa slipped into a technical recession during the second quarter of 2018 and the rand weakened significantly adding to the pressure on consumer spending. At the same time, input costs started to increase significantly. Despite this cost push, the market was characterised by manufacturer restraint on pricing in an attempt to minimise consumer inflation and maximise volumes. In addition, the group's VAMP division had a material impact on the results following the suspension of operations for the entire second half of the financial year.
The increase in VAT and further increases in the cost of transport and essential services weakened consumer demand in all categories except maize, where increased supply and price deflation stimulated demand. Domestic revenue fell by 9%, with volumes down 5% and price deflation of 4%. The suspension of operations at VAMP contributed 4% to the volume decline. The balance of the volume decline reflected a worse than expected performance in Groceries and Home and Personal Care. This was partially offset by volume and market share growth in Grains. Disappointingly, the positive volume performance in Grains was not reflected in operating income due to category deflation and increases in the cost of essential services resulting in margin pressure. Domestic operating income therefore declined by 28% to R3,0 billion. The impact of volume declines and pricing pressures on the group's gross margins was partially offset by another year of record savings in procurement and ongoing supply chain efficiencies. Gross margins declined by 90 basis points (bps) to 32,5%.
Outlook
The economic outlook for 2019 remains challenging with no signs of a significant recovery in economic growth or consumer confidence. We remain committed to the growth of our power brands, with a relentless focus on driving our cost conscious culture and developing a great place to work for all our employees, which we believe will result in superior returns and a beneficial outcome for all our stakeholders.
Tiger Brands (TBS) share valuation
So should you buy Tiger Brands shares? Well they trading at a relatively stiff PE ratio, they not trading at the highest dividend yield around. While their net profit margin of around 8.4% is pretty healthy, and it would have been even higher if it wasnt for the R380 million lost due to VWMP recalls. While the worst of the impact of the listeriosis outbreak one can assume is past Tiger Brands, one wonders if they will be able to win back the trust of consumers. In particular the brand assigned to the whole saga which is Enterprise.
The group has a very strong balance sheet, good cash generation and has managed to keep their trade and other receivables in check during difficult economic times. Based on their results we value the group at R280 a share. So at their current price they are very close to being fully valued. At this point in time if an investor wants to get into the food production and sales category, we would recommend Pioneer Foods ahead of Tiger Brands based on both's financial results published recently.