|
The continued rise and fall of Famous Brands shown on time line graphic
Date: 6 May 2019 Category: Stock Market |
Related Topics |
|
We take a look at the latest performance update from Famous Brands and its not looking good for the owners of
So they thought they could replicate this successful strategy in the UK. Oh boy were they wrong. Things started turning sour for the group soon after acquiring Gourmet Burger Kitchen |
|
6 May SENS that shows how much money GBK is bleeding
Below a SENS released by Famous Brands today (6 May 2019) giving a further update on expected earnings after they provided investors with a SENS announcement on 11 March 2019.
SENS starts
In the Voluntary Performance Update and Trading Statement (“Announcement”) released by the Company on the Stock Exchange News Service (“SENS”) on 11 March 2019, the board of directors (“Board”) advised that, while there was certainty that earnings per share (“EPS”) for the year ended 28 February 2019 (“review period”) would be below those of the previous year by more than 20%, a reasonable degree of certainty did not exist regarding the anticipated range expected for EPS.
Further to the Announcement, the Board is satisfied that it now has the reasonable degree of certainty required to provide further guidance with regard to the financial results of the Group for the review period. FINANCIAL RESULTS FOR THE REVIEW PERIOD
• The Group’s South African business will report an operating profit before non-operational items in line with the prior comparable period, while GBK Restaurants Limited (“GBK”) UK will record an operating loss before non-operational items of GBP4.6 million (2018: GBP3.7 million).
• The basic loss per share is expected to be within the range of 432 cents per share to 528 cents per share compared to the basic earnings per share of 22 cents per share in the prior corresponding period.
This decrease in EPS is attributable to the following factors:
- an impairment of R873.9 million (pre-tax) relating to the GBK UK business, recognised at Group level (as published in the interim results for the six months ended 31 August 2018, announced on SENS on 29 October 2018);
- once-off costs of R17.2 million for professional fees and redundancy costs related to the Company Voluntary Arrangement (“CVA”) completed at GBK UK during the review period; and
- an impairment of R25.5 million recognised in an associate company in which the Group has a minority stake.
• Basic headline earnings per share (“HEPS”) compared to the prior corresponding period are expected to be within the range of 265 cents to 329 cents per share (2018: 393 cents), being an approximate decrease of 33% to 16%. The Group’s annual results for the year ended 28 February 2019 will be released on or about 29 May 2019.
SENS ends
So essentially for the year under review Gourmet Burger Kitchen lost Famous Brands an additional R87.4 million. This is over and above the hundreds of millions in write offs Famous Brands took on GBK after it basically paid to much for the group and had to write down the value of their investment on their books. See our discussion on Famous Brands and its rise and fall as at 12 March 2019 below. Find that article here.
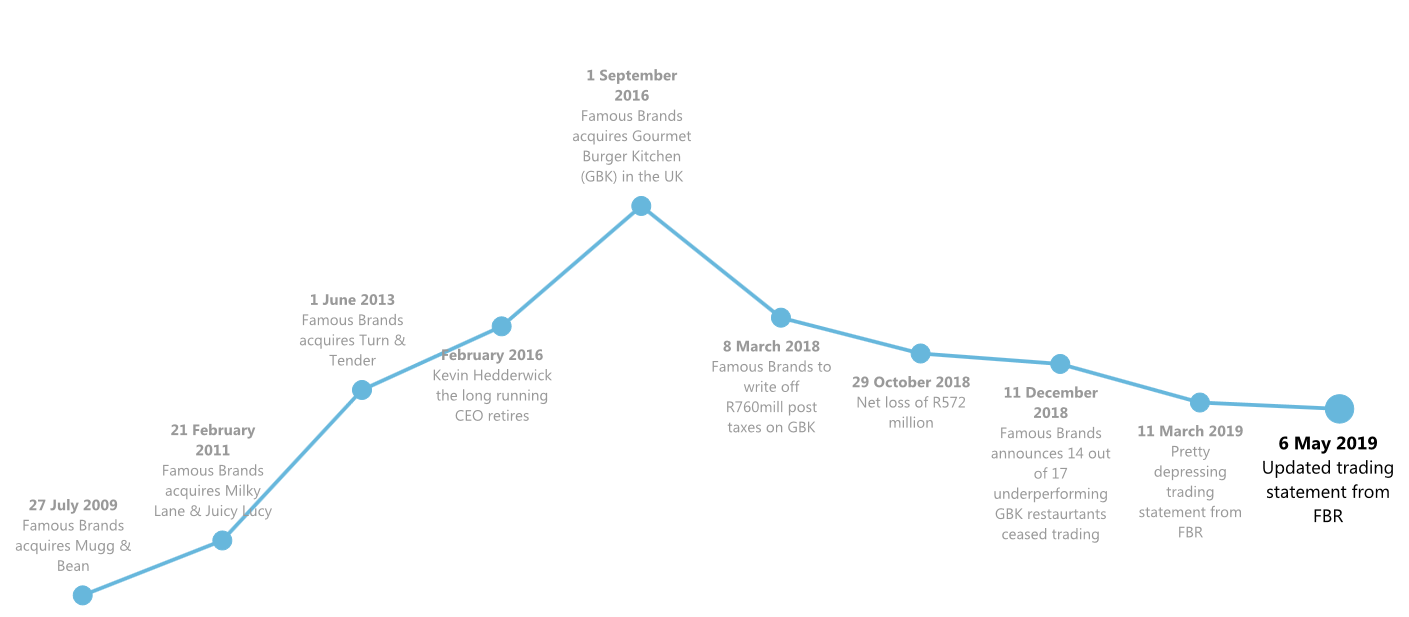
The image below shows significant events in FBR's history on a timeline chart, where the line is representative of the share price of the group at each event. And as can be seen from the line chart FBR shares have basically declined and continued to decline ever since it bought GBK.
SENS starts
In the Voluntary Performance Update and Trading Statement (“Announcement”) released by the Company on the Stock Exchange News Service (“SENS”) on 11 March 2019, the board of directors (“Board”) advised that, while there was certainty that earnings per share (“EPS”) for the year ended 28 February 2019 (“review period”) would be below those of the previous year by more than 20%, a reasonable degree of certainty did not exist regarding the anticipated range expected for EPS.
Further to the Announcement, the Board is satisfied that it now has the reasonable degree of certainty required to provide further guidance with regard to the financial results of the Group for the review period. FINANCIAL RESULTS FOR THE REVIEW PERIOD
• The Group’s South African business will report an operating profit before non-operational items in line with the prior comparable period, while GBK Restaurants Limited (“GBK”) UK will record an operating loss before non-operational items of GBP4.6 million (2018: GBP3.7 million).
• The basic loss per share is expected to be within the range of 432 cents per share to 528 cents per share compared to the basic earnings per share of 22 cents per share in the prior corresponding period.
This decrease in EPS is attributable to the following factors:
- an impairment of R873.9 million (pre-tax) relating to the GBK UK business, recognised at Group level (as published in the interim results for the six months ended 31 August 2018, announced on SENS on 29 October 2018);
- once-off costs of R17.2 million for professional fees and redundancy costs related to the Company Voluntary Arrangement (“CVA”) completed at GBK UK during the review period; and
- an impairment of R25.5 million recognised in an associate company in which the Group has a minority stake.
• Basic headline earnings per share (“HEPS”) compared to the prior corresponding period are expected to be within the range of 265 cents to 329 cents per share (2018: 393 cents), being an approximate decrease of 33% to 16%. The Group’s annual results for the year ended 28 February 2019 will be released on or about 29 May 2019.
SENS ends
So essentially for the year under review Gourmet Burger Kitchen lost Famous Brands an additional R87.4 million. This is over and above the hundreds of millions in write offs Famous Brands took on GBK after it basically paid to much for the group and had to write down the value of their investment on their books. See our discussion on Famous Brands and its rise and fall as at 12 March 2019 below. Find that article here.
The image below shows significant events in FBR's history on a timeline chart, where the line is representative of the share price of the group at each event. And as can be seen from the line chart FBR shares have basically declined and continued to decline ever since it bought GBK.
Since Famous Brands (FBR) bought Gourmet Burger Kitchen (GBK) it's share price has been in continued decline
11 March 2019 SENS investors were fearing.
The group released a SENS yesterday giving a performance update as well as expected date for when their financial results will be released. So lets take a look at the performance update first,
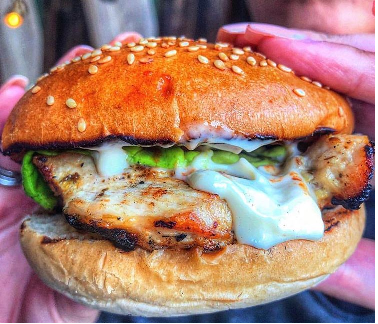
A Gourmet Burger Kitchen Chicken Burger. Image taken from their Instagram account
Quoted from SENS released
The Group's results for the year ended 28 February 2019 will be published on or about 29 May 2019.
In the interim, it is appropriate to provide shareholders with a brief voluntary performance update on the business. This update pertains to the twelve months ended 28 February 2019 for the Group's South Africa ("SA") and rest of Africa and Middle East ("AME") regions. The United Kingdom ("UK") operation narrative relates to the Gourmet Burger Kitchen Restaurants Ltd. ("GBK") business for the 52-week period ended 24 February 2019. Collectively this reporting period is referred to as the "review period".
During the review period, economic and political uncertainty persisted across all our markets. Challenging trading conditions constrained consumer discretionary spend and keen competitor activity intensified margin pressure. In the SA market, inconsistent power supply further worsened consumer sentiment and negatively impacted on the Company's operations.
Brands
The Group's restaurants trade in three primary markets, SA, AME and the UK. The brand portfolio is categorised into Leading (mainstream) and Signature (niche) brands.
SA
While strong organic growth was reported by the Group's Leading brands in the first six months of the current financial year, trading slowed down over the latter six months, with the Group's traditional peak holiday period results, specifically, failing to meet management's expectations. In line with recent performance trends, the Group's Leading brands delivered solid results. On balance, the Group's Signature brands under-performed management's expectations, and they remain the subject of critical review.
Across our Leading and Signature brands, combined system-wide sales increased 6.0%, while like-for-like sales grew by 2.5%. Independently, Leading brands system-wide sales rose 5.3%, with like-for-like sales up 2.9%. Signature brands system-wide sales increased 10.7%, while like-for-like sales declined by 0.6%.
AME
Our AME operations continued to deliver a good return on investments made over recent years, with pleasing performances reported in the region by Debonairs Pizza, Steers, Wimpy and Mugg & Bean. System-wide sales rose 5.9% in Rand terms.
GBK UK
During the review period, system-wide sales (Sterling) in the UK declined by 7.0%, while like-for-like sales decreased by 4.2% compared to the previous year. Notwithstanding this decline, management is optimistic that remedial actions underway are starting to gain momentum, reflected by the stronger trading results reported for the second 26 weeks ("H2") of the review period compared to the first 26 weeks ("H1"). H1 like-for-like sales were -9.7% while H2 sales were +1.6%. Furthermore, in the 16 weeks to 24 February 2019, GBK traded ahead of the market, reporting an increase in like-for-like sales of 4.0%.
On 11 December 2018, the Group notified shareholders that the board of directors of GBK had formally completed a Company Voluntary Arrangement ("CVA") aimed at improving the long-term financial viability and sustainability of the business.
In line with management's projections at the outset of the project, the once-off CVA cost is expected to be in the order of GBP18.3 million. This includes non-cash store write down costs totalling GBP14.4 million, as well as professional fees, redundancy payments, compensation fund costs and store strip- out charges, totalling GBP3.9 million.
Twenty four GBK stores were closed during the period in the UK, including closures which took place prior to the announcement of the CVA, as well as those which were part of the CVA close- out process.
Supply chain: Manufacturing & Logistics
Management's sustained drive to leverage efficiencies continued to enhance performance across the operations, but lower sales and persistently lower food inflation have started to impact on this division's volumes and sales.
Trading statement
The board of directors of Famous Brands ("Board") does not have the required degree of certainty to provide details of the anticipated range expected for earnings per share ("EPS") for the year ended 28 February 2019. The Board does however have the required degree of certainty that EPS will be below those of the previous year by more than 20%, hence the reason for this trading statement.
As and when the Board has the required degree of certainty to
provide a further update on this Trading Statement, it will do so.
End quote from SENS
So their system wide sales are growing slowly, and when looking at like for like sales they are even reporting declines in their numbers. So not only are they bleeding massive amounts of cash in the UK but their South Africa operations are taking significant strain too. It is no real surprise to see the Famous Brands share price continue its downward spiral.
The screenshot below (taken off Sharenet) shows the share price performance of Famous Brands over the last 5 years as well as provide the share price returns of the group over various time periods.
The screenshot below (taken off Sharenet) shows the share price performance of Famous Brands over the last 5 years as well as provide the share price returns of the group over various time periods.
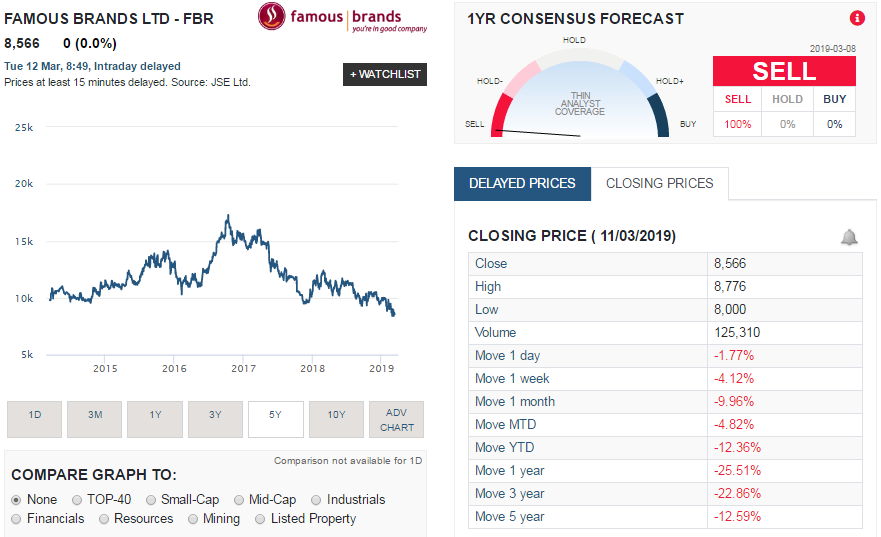
So lets take a look at Famous Brands share price performance over various time periods:
So lets take a look at a few significant events in the life and times of Famous Brands over the last couple of years on a time line graphic.
- 1 week: -4.12%
- 1 month: 9.96%
- Year to Date (YTD): -12.36%
- 1 year: -25.51%
- 3 years: -22.86%
- 5 years: -12.59%
So lets take a look at a few significant events in the life and times of Famous Brands over the last couple of years on a time line graphic.
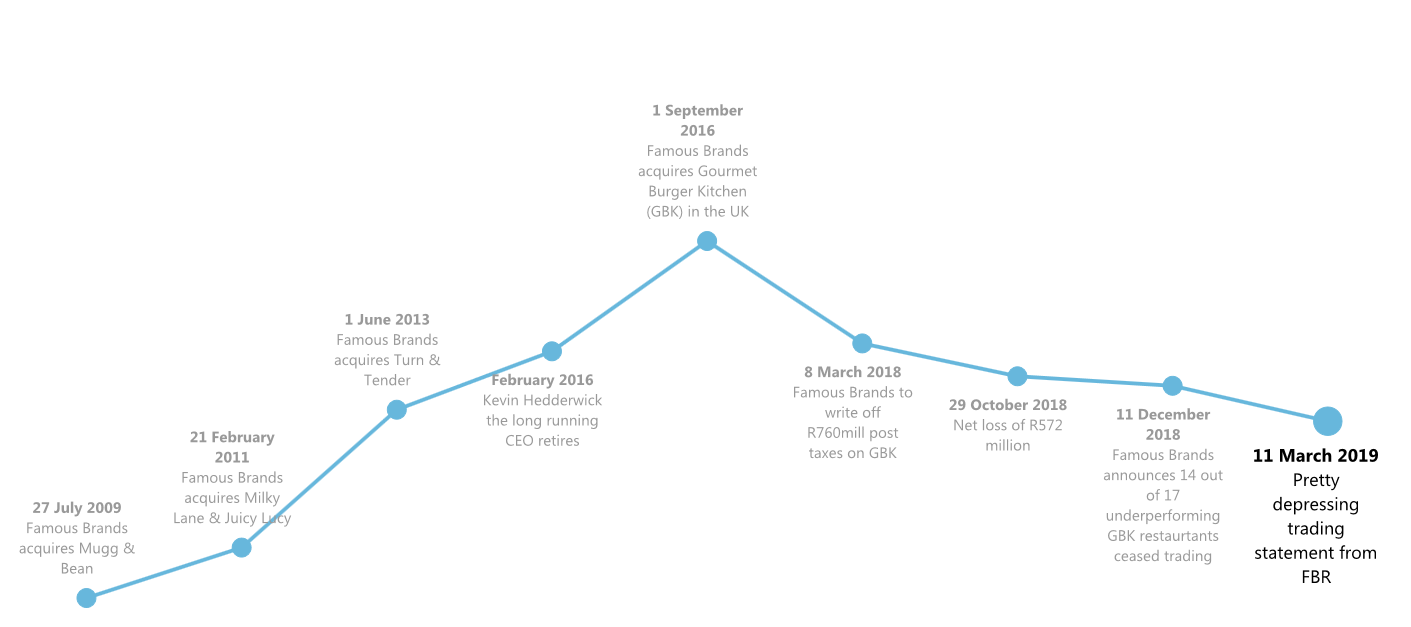
The above images shows some of the significant events in recent years for the Famous Brands Group. They include:
- FBR acquisition of Mugg & Bean
- FBR acquisition of Milky Lane and Juicy Lucy
- Retirement of long term CEO, Kevin Hedderwick
- Acquisition of Gourmet Burger Kitchen (GBK)