|
South Africa's economic performance under Thabo Mbeki
Date: 6 September 2018 Category: Economics |
Related Topics |
|
In this article we focus on the economic performance of South Africa under the leadership of President Thabo Mbeki. Under President Thabo Mbeki South Africa experienced the longest period of economic growth in its short history since the dawn of democracy.
While President Mbeki had his issues while in charge of South Africa, such as his views on HIV/AIDS and his "quiet diplomacy" with regards to Zimbabwe, there is no denying South Africa's economy thrived while he was at the helm. Surely |
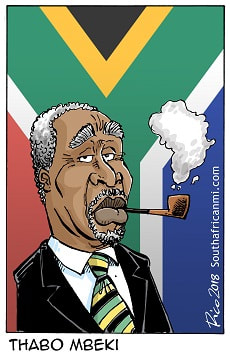
Thabo Mbeki Caricature
|
South Africa's economy steamed ahead under President Mbeki
When President Thabo Mbeki took over from President Nelson Mandela, the hard work for ensuring economic growth and new infrastructure investments and setting up new businesses in South Africa was already done, so President Mbeki's job was to nurture and look after the ground work that was done under President Nelson Mandela.
Quarterly GDP
The graphic below shows the quarter on quarter annualised seasonally adjusted GDP growth rates and the different colours represents the different presidents of the republic since the dawn of democracy. As the graphic below shows in only 1 quarter under President Thabo Mbeki did South Africa's economy enter negative territory. And this was largely due to the financial crises set on by the US sub prime mortgage crises. And while the sub prime mortgage crises hit South Africa, ANC member Jacob Zuma was plotting to remove Mbeki and get himself into power. The ANC recalled Mbeki, and placed Kgalema Motlanthe in the position of interim President. Sadly he was just the care taker and under his watch as President of the country South Africa experienced its first recession since democracy.
During President Thabo Mbeki's tenure as leader of South Africa, South Africa experienced an average GDP growth rate of 4.2% (quarter on quarter annualised) and inflation averaged 5.7%. The combination of president Mbeki and finance minister Manual proved to be the most successful economic combination in South Africa's young history. South Africa experienced 36 consecutive quarters of positive economic growth during the period in which Thabo Mbeki was president and Trevor Manual was finance minister.
It has to be said they were in charge of the country and finances during a "sweet spot" for South Africa. Demand for commodities were surging (largely driven by China), prices for commodities were surging ahead, all leading to South African companies making massive profits from the exports of commodities. Some economists have lamented the fact that SA did not grow at higher rates during this time, focused more on improving the levels of education, and invested more into infrastructure and other less volatile and vulnerable industries, to ensure future job creation and a lesser dependence on volatile commodity markets and prices. Sadly this never really happened and South Africa is still seen as a largely commodity driven economy.
It has to be said they were in charge of the country and finances during a "sweet spot" for South Africa. Demand for commodities were surging (largely driven by China), prices for commodities were surging ahead, all leading to South African companies making massive profits from the exports of commodities. Some economists have lamented the fact that SA did not grow at higher rates during this time, focused more on improving the levels of education, and invested more into infrastructure and other less volatile and vulnerable industries, to ensure future job creation and a lesser dependence on volatile commodity markets and prices. Sadly this never really happened and South Africa is still seen as a largely commodity driven economy.
Rand/Dollar exchange rate
There is probably no better gauge of a country's economic performance, or the sentiment towards a country's economic fortunes and prospects than a country's exchange rate. A strong exchange rate shows that there is a strong demand for that country's currency, be it because of investors seeing it as a safe haven, or demand for the country's currency as companies and people are looking to invest there. On the flip side, a weak exchange rate shows investors, companies, traders etc are favouring other countries currencies instead of the local currency. And this could be due to various different reasons.
When President Mbkei took office the exchange rate was sitting at around R6.94 to the US dollar. By the time he was recalled and replaced by President Motlanthe the Rand was trading at around R8.44. About a 21% depreciation during this period. The exchange rate picture would have looked better under President Mbeki if it wasn't for the financial crises in the US, which spread to the rest of the world, which ultimately meant investors and traders took their money out of "riskier" emerging markets such as South Africa and rather invested in the safe havens such as the US. Leading to massive declines in the exchange rate during this period.
When President Mbkei took office the exchange rate was sitting at around R6.94 to the US dollar. By the time he was recalled and replaced by President Motlanthe the Rand was trading at around R8.44. About a 21% depreciation during this period. The exchange rate picture would have looked better under President Mbeki if it wasn't for the financial crises in the US, which spread to the rest of the world, which ultimately meant investors and traders took their money out of "riskier" emerging markets such as South Africa and rather invested in the safe havens such as the US. Leading to massive declines in the exchange rate during this period.
While a 21% depreciation in the exchange rate under President Mbeki sounds pretty bad, when President Jacob Zuma took office, the exchange rate was hovering around R7.32 to the US Dollar. By the time the ANC finally got rid of him as president, the average exchange rate during 2017, the last year of Jacob Zuma rule, was sitting at R13.31. Thats a whopping 84% depreciation. Which puts the 21% decline in the exchange rate under President Mbkei to shame.
Unemployment under Mbeki
When President Mbeki took over from President Mandela, the unemployment rate was sitting at around 22%, based on ILO estimates of the unemployment rate in South Africa from 1994 to 1999. The average unemployment rate in mbki's term was 23.7%. So unemployment increased under Mbeki's watch. But there are a few factors one needs to take into account when it comes to unemployment under Mbeki's watch. They include:
1. Far more school graduates entering the job market
2. Massive advances in technology and machinery lead to labour intensive jobs declining
3. Strong declines in mining output meant lots of labour jobs being shed
4. Onset of the financial crises caused by the US sub prime mortgage crises.
While unemployment increased slightly in South Africa during Mbeki's watch, the strong economic growth under is watch meant the GDP per capita (size and value of the economy per person living in South Africa increased substantially). The image below shows the GDP per capita per president.
It is clear from the graphic above that the GDP per capita under President Mbkei's rule advanced strongly, and this should and will be his lasting legacy when people look back at the economic performance under his watch. The increase in the GDP per capita under his watch will probably never be matched by another President in South Africa. President Mbeki, was in charge of South Africa during South Africa's most prosperous economic growth phase since democracy.