South Africa's mining production and sales up to end August 2022
|
Category: Mining production and sales
Date: 17 October 2022 Mining production and sales numbers shows that South Africa's coal production and sales numbers have increased sharply while at the same time platinum group metals (PGM) has seen sharp declines.
|
|
Coal on the up, platinum on the decline
Based on the latest mining production and sales numbers released by Statistics South Africa its clear that coal mining output and sales are on the up while there were significant declines experienced in the platinum mining sector. And no real surprise is the continued decline of the gold mining industry in South Africa. The statistical release stated the following:
Mineral sales at current prices increased by 4,3% year-on-year in August 2022. The largest positive contributors were:
Seasonally adjusted mineral sales at current prices decreased by 1,3% in August 2022 compared with July 2022. This followed month-on-month changes of 6,6% in July 2022 and -15,8% in June 2022. Mineral sales at current prices decreased by 5,8% in the three months ended August 2022 compared with the previous three months.
Mineral sales at current prices increased by 4,3% year-on-year in August 2022. The largest positive contributors were:
- coal (83,1% and contributing 15,0 percentage points);
- ‘other’ non-metallic minerals (70,0% and contributing 2,3 percentage points);
- manganese ore (42,4% and contributing 1,8 percentage points); and ‘other’ metallic minerals (86,4% and contributing 1,4 percentage points).
- PGMs (-25,0% and contributing -9,7 percentage points), iron ore (-36,5% and contributing -4,7 percentage points)
- Gold (-20,5% and contributing -3,3 percentage points) were significant negative contributors.
Seasonally adjusted mineral sales at current prices decreased by 1,3% in August 2022 compared with July 2022. This followed month-on-month changes of 6,6% in July 2022 and -15,8% in June 2022. Mineral sales at current prices decreased by 5,8% in the three months ended August 2022 compared with the previous three months.
Total value of mineral sales in South Africa per month
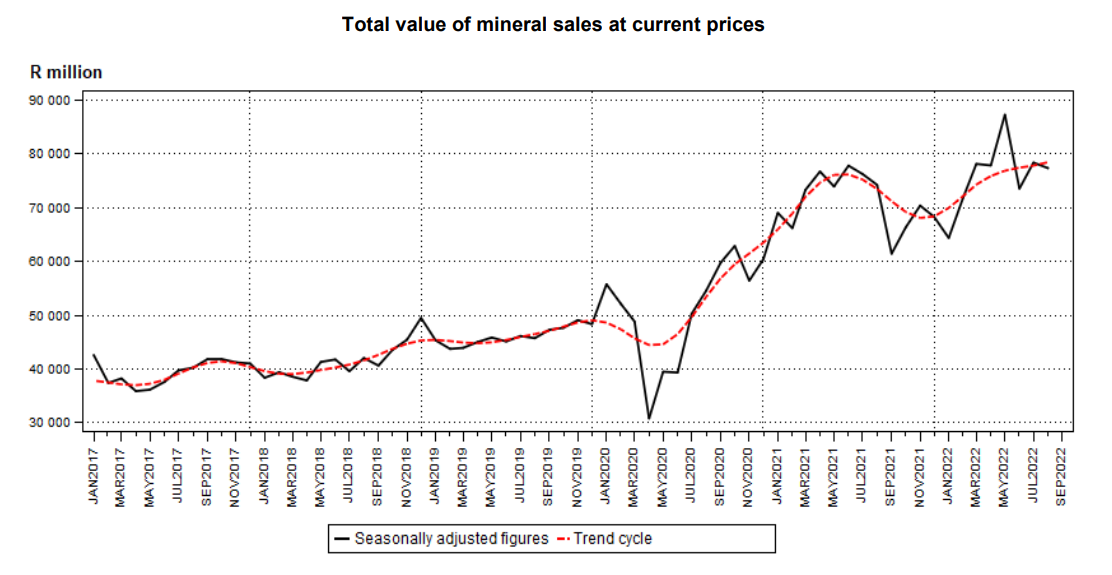
Total value of mineral sales in South Africa per month
Seasonally adjusted mining production increased by 0,6% in the three months ended August 2022 compared with the previous three months. Manganese ore (12,5% and contributing 0,9 of a percentage point) and coal (2,4% and contributing 0,6 of a percentage point) were the largest positive contributors. PGMs (-5,7% and contributing -1,4 percentage points) was a significant negative contributor
Seasonally adjusted data removes the effects of seasonal patterns from the data to provide a clearer indication of the underlying trends in the data being published
Seasonally adjusted data removes the effects of seasonal patterns from the data to provide a clearer indication of the underlying trends in the data being published