South African Market Insights
  • Home
  • Blog
    • Blog-5Jun2018
    • Blog-18May2018
    • Blog-16May2018
    • Blog-3May2018
    • Blog-2May2018
    • Blog-30Apr2018
    • Blog-26Apr2018
    • Blog-24Apr2018
    • Blog-18Apr2018
    • Blog-17Apr2018
    • Blog-16Apr2018
    • Blog-3Apr2018
    • Blog-22Mar2018
    • Blog-20Mar2018
    • Blog-19Mar2018
    • Blog-23Oct2017
    • Blog-20Oct2017
    • Blog-11Oct2017
    • Blog-10Oct2017
    • Blog-6Oct2017
    • Blog-3Oct2017
    • Blog-2Oct2017
  • Economics
    • Rand Dollar Exchange Rate
    • South Africa's GDP
    • South Africa's Unemployment
    • SA by numbers
    • Economic Progress Index
    • Taylors Rule
    • South Africa's Formal Business Sector
    • South-Africa's-Fiscal-Policy
    • SA EU Trade Data
    • Inflation Heat Map
    • Population Density Map
    • Labour Market Dynamics
    • Estimating the Size of the Informal Economy
    • SA Consumer Spending Patterns
    • South Africa's Monetary Fiscal Policy Mix
    • GDP Animations >
      • SouthAfrica
      • WesternCape
      • EasternCape
      • NorthernCape
      • FreeState
      • KwaZuluNatal
      • NorthWest
      • Gauteng
      • Mpumalanga
      • Limpopo
    • South Africa's Economic Structure
    • South Africa's Economic History
    • South Africa's Trade Data Page
    • South Africa's Food and Beverages Sector
    • Financial Well-being of South African Companies_2015
    • SA vs the World
    • Budget Day Page (24 Feb 2016)
  • Stock in Focus
    • JSE ALSI Chart
    • Sector Comparison Page
    • JSE-Calendar-Tracker-2019
    • Adcorp (ADR)
    • Amazon (AMZN)
    • Apple (AAPL)
    • Ascendis (ASC)
    • AVI (AVI)
    • Bidvest (BVT)
    • Blue Label Telecoms (BLU)
    • Bowler Metcalf (BCF)
    • Capitec (CPI)
    • City Lodge Hotel Group
    • Clicks Group (CLS)
    • Coronation (CML)
    • Curro Holdings (COH)
    • Discovery (DSY)
    • Distell (DST)
    • EOH (EOH)
    • Famous Brands (FBR)
    • Ferrari (RACE)
    • FirstRand Group (FSR)
    • Grindrod (GND)
    • GrowthPoint (GRT)
    • Holdsport (HSP)
    • Harley-Davidson (HOG)
    • Hyprop (HYP)
    • Hyprop (HYP)_1Jun2016
    • Investec Property Fund (IPF)
    • JSE (JSE)
    • Massmart (MSM)
    • MediClinic (MEI)
    • MTN (MTN)
    • MTN (MTN)_May2016
    • Mr Price Group (MRP)
    • Mr Price Group (MRP)_8APR2016
    • Nedbank (NED)
    • OneLogix (OLG)
    • Peregrine Holdings (PGR)
    • Pick 'n Pay Stores (PIK)
    • Pioneer Foods (PFG)
    • PSG Group (PSG)
    • Quantum Foods (QFH)
    • RCL Foods (RCL)
    • Remgro (REM)
    • Richemont (CFR)
    • RMB Holdings (RMH)
    • Rolfes (RLF)
    • Sanlam (SLM)
    • Sasol (SOL)
    • Sasol (SOL)_18sep2016
    • Santova (SNV)
    • Spar Group (SPP)
    • Shoprite Holdings (SHP)
    • Spur Corporation (SUR)_7Sep2017
    • Standard Bank (SBK)
    • Steinhoff International Holdings (SNH)
    • Stor-Age (SSS)
    • Super Group (SPG)
    • Taste Holdings (TAS)_30May2016
    • The Foshini Group (TFG)
    • Value Logistics (VLE)
    • Vodacom (VOD)
    • Wilson Bayly Holmes Ovcon (WBO)
    • Woolworths (WHL)
    • Woolworths (WHL)_24Aug2017
    • Zeder (ZED)
  • Online Calculators
    • Rand Petrol Price Estimator
    • Share Valuation
    • Financial Ratios Calculator
    • GDP Growth Estimator
    • Future Value of Investment Calculator
    • Loan repayment calculator
  • Contact
  • About
  • Search

< South Africa's GDP
Economics Main Page >

South Africa's trade with Russia during January and February 2020

Category: Imports, Exports and International Trade
Date: 4 April 2020

Related Topics

  • South Africa's trade with the United States
  • South Africa's trade with Japan
  • South Africa's trade with Nigeria
We take a look at the latest trade data released by South Africa's customs office the South African Revenue Service (SARS) and focus on trade between South Africa and Russia, two BRICS partners. 

Has the impact of the Coronavirus started to show in trade between nations during February 2020 or is it still to early to see the impact of Coronavirus on international trade.

St Peter's Square in Moscow, Russia

South Africa's exports to Russia from January 2020 to February 2020

So lets start off by looking at the main product categories exported by South Africa to Russia.  The summary below shows the total value of South Africa's exports to Russia for January and February 2020 per major product category, sorted from biggest export category to smallest (based on Rand value exported).
  • Vegetables: R 334 511 185
  • Mineral Products: R 92 843 456
  • Machinery: R 86 689 690
  • Plastics & Rubber: R 77 184 841
  • Prepared foodstuffs: R 38 688 877
  • Chemicals: R 19 686 725
  • Products Iron & Steel: R 19 618 454
  • Vehicles aircraft & vessels: R 10 573 068
  • Photographic & medical equipment: R 3 713 821
  • Precious Metal: R 1 017 372
  • Works of art: R 873 919
  • Textiles: R 802 734
  • Raw hides & leather: R 365 643
  • Live animals: R 213 061
  • Wood Products: R 159 018
  • Toys & Sport apparel: R 82 716
  • Wood pulp & paper: R 76 586
  • Stone & Glass: R 2 026
  • Animal or vegetable fats: R 0
  • Footwear: R 0
  • Other unclassified goods: R 0​
  • Total Exports to Russia: R 687 103 192
​
The treemap below represents the information above graphically
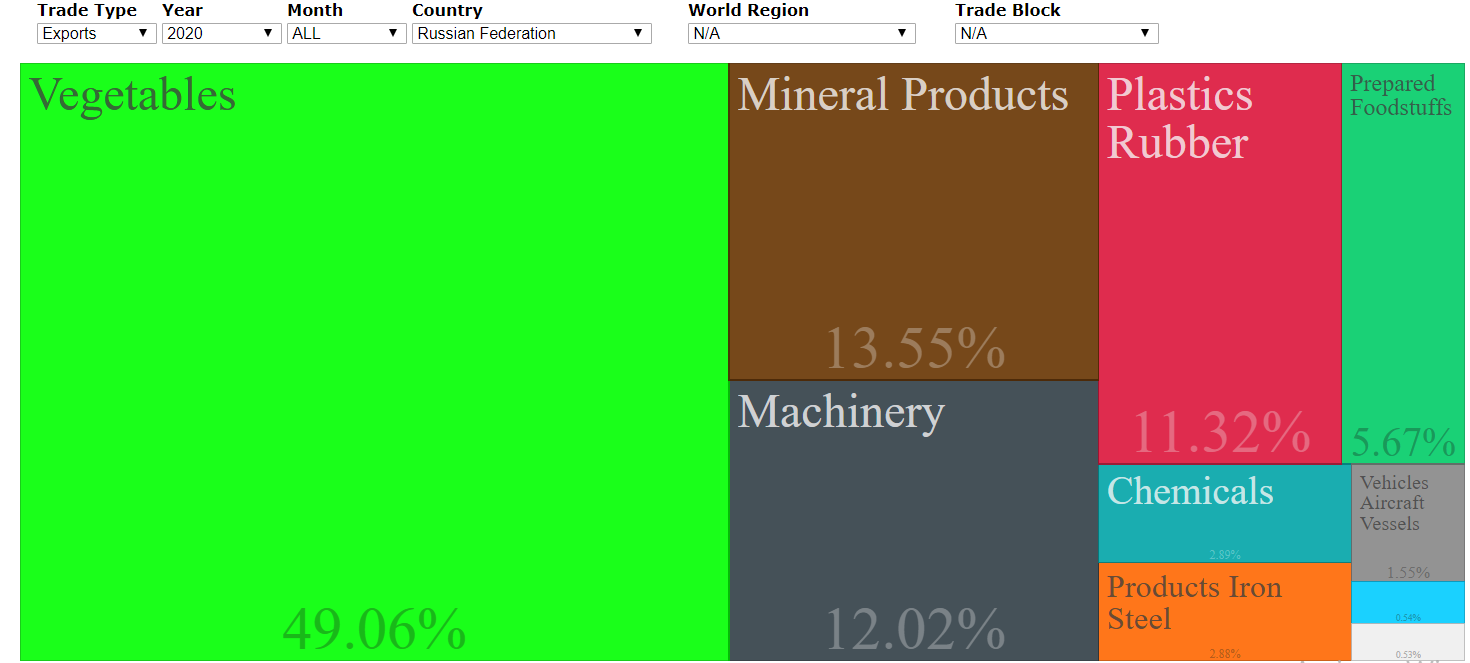
South Africa's major product exports to Russia
As the treemap shows the bulk of South Africa's exports to Italy is made up by Products of Iron and Steel, with it making up over 32% of total exports to Italy during 2019, followed by Mineral products which made up 14.13% of total South African exports to Italy during 2019. The third biggest export product category is Live animals, with Live animals being exported to Italy making up just over 10% of South Africa's total exports to Italy during 2019.

Advertisement (and yes South Africans can buy from Amazon as they ship to SA)

South Africa's imports from Russia from January 2020 to February 2020

Next up we take a look at the ​main product categories imported from Russia into South Africa.  The summary below shows the total value of South Africa's imports from Russia for January and February 2020 per major product category, sorted from biggest import category to smallest (based on Rand value imported).
  • Products Iron & Steel: R 571 004 746
  • Chemicals: R 162 554 931
  • Mineral Products: R 100 030 538
  • Wood pulp & paper: R 69 175 317
  • Precious Metal: R 57 791 999
  • Machinery: R 21 729 999
  • Plastics & Rubber: R 16 798 592
  • Wood Products: R 10 331 287
  • Live animals: R 9 283 535
  • Vegetables: R 6 586 315
  • Other unclassified goods: R 3 061 343
  • Prepared foodstuffs: R 2 454 366
  • Photographic & medical equipment: R 2 159 704
  • Toys & Sport apparel: R 807 081
  • Vehicles aircraft & vessels: R 115 837
  • Stone & Glass: R 95 619
  • Textiles: R 65 479
  • Equipment Components: R 40 263
  • Works of art: R 20 358
  • Raw hides & leather: R 6 458
  • Animal or vegetable fats: R 0
  • Footwear: R 0
  • Total Imports from Russia: R 1 034 113 767​
​
The treemap below represents the information above graphically
South Africa's major product imports from Italy
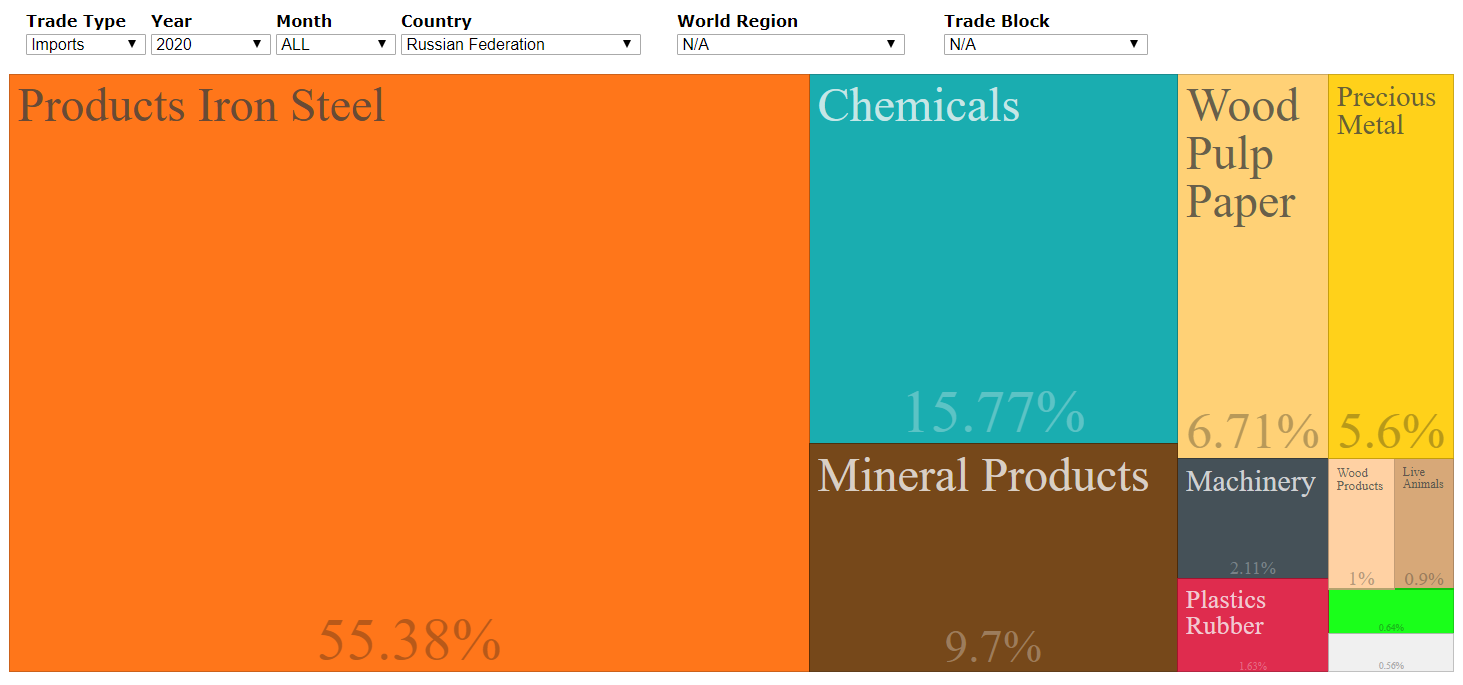
South Africa's major product imports fromRussia
As the treemap above shows the biggest product import category during  January and February 2020 is Products of Iron and Steel with it making up almost 56% of South Africa's imports from Russia so far in 2020. The second biggest import category for South Africa from Russia is Chemicals with it making up around 16% of South Africa's imports while Mineral Products is the third biggest import category and it makes up just under 10% of South Africa's imports from Russia

South Africa's trade balance per major product category traded with Italy

The summary below shows South Africa's trade balance with Italy for the major product groupings, sorted from highest trade surplus (where South Africa exported more of a product group to Italy than what imported) to biggest trade deficit (where South Africa imported more of a major product group from Italy than what it exported to Italy).
  • Products Iron & Steel: R 1 733 598 057
  • Live animals: R 1 022 574 247
  • Vegetables: R 593 933 768
  • Raw hides & leather: R 297 791 093
  • Textiles: R 175 861 180
  • Works of art: R 21 876 764
  • Wood Products: R -30 451 739
  • Other unclassified goods: R -33 393 011
  • Animal or vegetable fats: R -96 402 277
  • Precious Metal: R -134 796 415
  • Wood pulp & paper: R -545 612 674
  • Stone & Glass: R -606 417 044
  • Toys & Sport apparel: R -613 945 941
  • Footwear: R -649 942 706
  • Equipment Components: R -730 324 891
  • Photographic & medical equipment: R -937 073 163
  • Prepared foodstuffs: R -1 125 137 285
  • Plastics & Rubber: R -1 607 088 376
  • Mineral Products: R -1 813 140 465
  • Vehicles aircraft & vessels: R -2 005 780 028
  • Chemicals: R -3 869 018 371
  • Machinery: R -10 752 377 890
  • Trade Balance with Italy in 2019: R -21 705 267 167​


Yesterday we reported good news for South Africa, where South Africa exported R25.54 billion more worth of goods to the United Kingdom than what they imported from the United Kingdom, when looking at South Africa's trade balance with Italy the story is totally different, with South Africa reporting a trade deficit with Italy during 2019 to the amount of -R21.7 billion. Basically South Africa imported R21,7 billion more in goods from Italy than what it exported to Italy. With Italy's trade deficit almost all but cancelling out the positive trade balance South Africa reported with the UK.

What would be interesting to observe is how trade between South Africa and Italy is affect from February 2020 onward with the significant outbreak of the Coronavirus in Italy. We will keep a close eye on this topic in coming weeks and months.

Newsletter Subscription:

    Please enter your email address below to subscribe to our newsletter. It will be ad hoc newsletters and we wont bombard your email inbox with emails. We will NEVER supply your contact details to any third party.

Subscribe to Newsletter

Additional content

Related Topics

  • ​South Africa's GDP
  • ​South Africa's unemployment
  • ​Employment in the gold mining industry
  • ​South Africa's manufacturing


​Homepage

Economics Page
Stock in Focus Page


​About


Contact Us

Copyright © 2015
  • Home
  • Blog
    • Blog-5Jun2018
    • Blog-18May2018
    • Blog-16May2018
    • Blog-3May2018
    • Blog-2May2018
    • Blog-30Apr2018
    • Blog-26Apr2018
    • Blog-24Apr2018
    • Blog-18Apr2018
    • Blog-17Apr2018
    • Blog-16Apr2018
    • Blog-3Apr2018
    • Blog-22Mar2018
    • Blog-20Mar2018
    • Blog-19Mar2018
    • Blog-23Oct2017
    • Blog-20Oct2017
    • Blog-11Oct2017
    • Blog-10Oct2017
    • Blog-6Oct2017
    • Blog-3Oct2017
    • Blog-2Oct2017
  • Economics
    • Rand Dollar Exchange Rate
    • South Africa's GDP
    • South Africa's Unemployment
    • SA by numbers
    • Economic Progress Index
    • Taylors Rule
    • South Africa's Formal Business Sector
    • South-Africa's-Fiscal-Policy
    • SA EU Trade Data
    • Inflation Heat Map
    • Population Density Map
    • Labour Market Dynamics
    • Estimating the Size of the Informal Economy
    • SA Consumer Spending Patterns
    • South Africa's Monetary Fiscal Policy Mix
    • GDP Animations >
      • SouthAfrica
      • WesternCape
      • EasternCape
      • NorthernCape
      • FreeState
      • KwaZuluNatal
      • NorthWest
      • Gauteng
      • Mpumalanga
      • Limpopo
    • South Africa's Economic Structure
    • South Africa's Economic History
    • South Africa's Trade Data Page
    • South Africa's Food and Beverages Sector
    • Financial Well-being of South African Companies_2015
    • SA vs the World
    • Budget Day Page (24 Feb 2016)
  • Stock in Focus
    • JSE ALSI Chart
    • Sector Comparison Page
    • JSE-Calendar-Tracker-2019
    • Adcorp (ADR)
    • Amazon (AMZN)
    • Apple (AAPL)
    • Ascendis (ASC)
    • AVI (AVI)
    • Bidvest (BVT)
    • Blue Label Telecoms (BLU)
    • Bowler Metcalf (BCF)
    • Capitec (CPI)
    • City Lodge Hotel Group
    • Clicks Group (CLS)
    • Coronation (CML)
    • Curro Holdings (COH)
    • Discovery (DSY)
    • Distell (DST)
    • EOH (EOH)
    • Famous Brands (FBR)
    • Ferrari (RACE)
    • FirstRand Group (FSR)
    • Grindrod (GND)
    • GrowthPoint (GRT)
    • Holdsport (HSP)
    • Harley-Davidson (HOG)
    • Hyprop (HYP)
    • Hyprop (HYP)_1Jun2016
    • Investec Property Fund (IPF)
    • JSE (JSE)
    • Massmart (MSM)
    • MediClinic (MEI)
    • MTN (MTN)
    • MTN (MTN)_May2016
    • Mr Price Group (MRP)
    • Mr Price Group (MRP)_8APR2016
    • Nedbank (NED)
    • OneLogix (OLG)
    • Peregrine Holdings (PGR)
    • Pick 'n Pay Stores (PIK)
    • Pioneer Foods (PFG)
    • PSG Group (PSG)
    • Quantum Foods (QFH)
    • RCL Foods (RCL)
    • Remgro (REM)
    • Richemont (CFR)
    • RMB Holdings (RMH)
    • Rolfes (RLF)
    • Sanlam (SLM)
    • Sasol (SOL)
    • Sasol (SOL)_18sep2016
    • Santova (SNV)
    • Spar Group (SPP)
    • Shoprite Holdings (SHP)
    • Spur Corporation (SUR)_7Sep2017
    • Standard Bank (SBK)
    • Steinhoff International Holdings (SNH)
    • Stor-Age (SSS)
    • Super Group (SPG)
    • Taste Holdings (TAS)_30May2016
    • The Foshini Group (TFG)
    • Value Logistics (VLE)
    • Vodacom (VOD)
    • Wilson Bayly Holmes Ovcon (WBO)
    • Woolworths (WHL)
    • Woolworths (WHL)_24Aug2017
    • Zeder (ZED)
  • Online Calculators
    • Rand Petrol Price Estimator
    • Share Valuation
    • Financial Ratios Calculator
    • GDP Growth Estimator
    • Future Value of Investment Calculator
    • Loan repayment calculator
  • Contact
  • About
  • Search