|
Related Topics |
|
We take a look at the trading update released by Shoprite (SHP) that they snuck in after the market close today, probably hoping investors wont notice it. We suspect the retail armageddon that has been hitting Woolworths, Mr Price and Massmart will hit Shoprite hard after this trading update.
|
|
Lets get straight to the trading update released after market close today
Following the operational update for the 26 weeks to December 2018, the Group is in the
process of finalising its financial results for the period. After the adoption of IFRS 9 and IFRS
15, the effect of the impact of Hyperinflation accounting as well as the transition to moving
average cost for the valuation of stock, the company is satisfied that a reasonable degree of
certainty exists that the financial results for this period is likely to vary by at least 20% from the
corresponding period.
The low turnover growth resulting from low food inflation, temporary stock availability challenges and currency devaluations combined with lower Non-RSA gross margins and inflexible expense growths have adversely affected profitability. Given the numerous once-off costs and challenging trading environment, the Group anticipates lower earnings per share (“EPS”) and headline earnings per share (“HEPS”) for the 26-week period ended 30 December 2018, falling within the ranges below:
Including Hyperinflation adjustment:
Basic HEPS (cents) 441.1 - 388.6 ( -16% to -26% compared to prior year)
Basic EPS (cents) 421.6 - 369.5 (-19% to -29% compared to prior year)
Excluding Hyperinflation adjustment:
Basic HEPS (cents) 387.4 - 334.9 ( -26% to -36% compared to prior year)
Basic EPS (cents) 369.9 - 317.8 (-29% to -39% compared to prior year)
Profitability in the Group’s Non-RSA business suffered mainly as a result of the Angolan operation, where the 85% devaluation in the local currency against the dollar since the beginning of 2018 caused affordability challenges. The Group absorbed most of the price increases driven by higher import costs which simply could not be passed on to consumers given the current economic recession. Higher US dollar linked rentals in the Non-RSA operations also made local currency cost containment challenging. In the Group’s RSA business, the following factors impacted profitability:
- Deflation (the Group still had 10,719 items in deflation in December) in basic food categories in which the Group commands a higher than average market share.
- Supply constraints stemming from industrial action and the deployment of a new ERP IT system resulted in lost sales in the period. Additional labour costs were incurred to ensure our supply chain remained operational and brought up to full efficiency over the festive season.
- Adjustments relating to the change in accounting estimate between retail method of accounting and moving average cost impacted Gross Margin. - Cost increases in rentals, electricity, security, transport and depreciation could not be curtailed in line with the lower than expected top line growth.
The Group remains positive about its operational strength, customer support for its brands and continues to make progress on its longer term strategic priorities. The transformational changes we made during the year-long migration to a new IT system were challenging, but the deployment has now been completed. January 2019 has seen the improved trading trend continue and we are confident of an improved second half as the impact of various once-offs continues to ease.
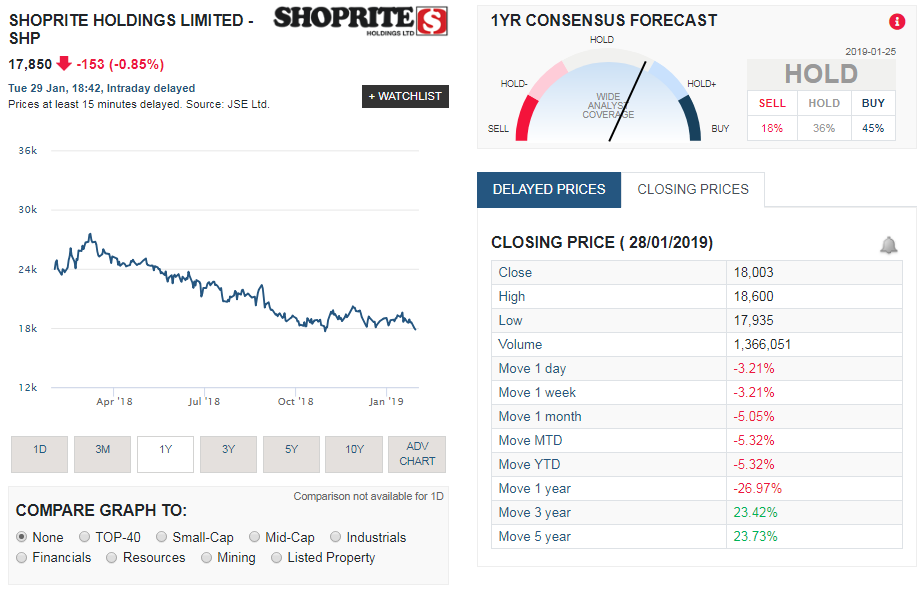
Share price performance
The screenshot below shows the performance of SHP's share price over the last year, as well as the performance of the stock over various time frames. The share has declined by -5.32% from the start of the year. We predict that tomorrow this will be a lot lower. We think the market will punish SHP as hard as it punished Mr Price (MRP), Massmart (MSM), Vodacom (VOD) and Woolworths (WHL)