|
Related Topics |
|
In this page we take a look at South Africa's economy and compare it to its African peers. The page will be updated on a regular basis as new and interesting information and data becomes available.
|
|
14 August 2019: Non performing loans across various African countries
Based on data released by the International Monetary Fund (IMF) South Africa and Namibia has the best track record in terms of non performing loans as a percentage of total loans issues.
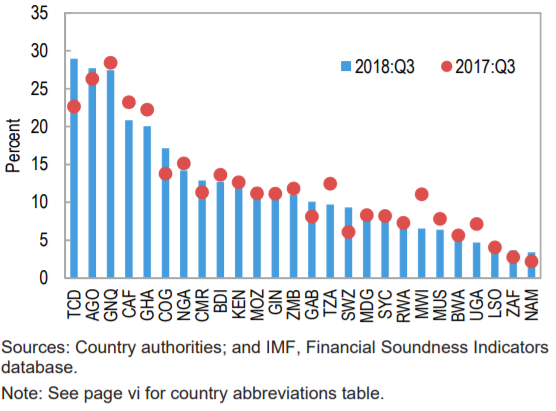
Chad has the highest percentage of non performing loans with almost 30% of loans issued being written off as it is not being paid back (as at Q3:2018) and this while non performing loans was sitting at around 22% as at Q3:2017. Angola also has a very high percentage of non performing loans with it hovering around 27% as at Q3:2018.
In general it looks like for most African countries the percentage of non performing loans has remained relatively stable between Q3:2107 to Q3:2018. And some countries actually recorded marked improvements in their non performing loans percentages.
In general it looks like for most African countries the percentage of non performing loans has remained relatively stable between Q3:2107 to Q3:2018. And some countries actually recorded marked improvements in their non performing loans percentages.
11 August 2019: Intraregional trade in Africa remains low
We take a look at a report published by UNCTAD that shows intraregional trade in Africa remains low compared to some of the other continents. Basically African countries aren't trading enough with one another. It is one of the main shortcomings for the African continent and its development. African countries in general does not produce a large variety of products, thus the bulk of goods imported into these countries come from more manufacturing intensive countries (especially, Asia, Europe and the Americas)
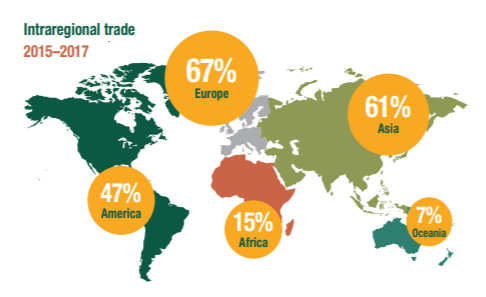
As the image above shows the most intraregional trade takes place in Europe, followed closely by Asia and then the Americas. Africa has intraregional trade of 15%. UNCTAD had the following to say regarding intraregional trade when breaking it down on product or sector level.
"With regard to the product and sectoral composition of intra-African trade, the continental market remains limited in size, yet intra-African exports appear to be more diversified and less primary commodity-dependent than exports from Africa to the rest of the world. Mineral products (petroleum, ores, etc.) account for 33 per cent of intraAfrican exports and constitute 50 per cent of total exports from Africa to the rest of the world (figure 4). The concentration of exports to the rest of the world on mineral products is also markedly evident at the regional economic community level. At the aggregate level, in 2015–2017, exports of manufactures accounted for 45 per cent of intra-African exports, but only 20 per cent of exports from Africa to the rest of the world"
"With regard to the product and sectoral composition of intra-African trade, the continental market remains limited in size, yet intra-African exports appear to be more diversified and less primary commodity-dependent than exports from Africa to the rest of the world. Mineral products (petroleum, ores, etc.) account for 33 per cent of intraAfrican exports and constitute 50 per cent of total exports from Africa to the rest of the world (figure 4). The concentration of exports to the rest of the world on mineral products is also markedly evident at the regional economic community level. At the aggregate level, in 2015–2017, exports of manufactures accounted for 45 per cent of intra-African exports, but only 20 per cent of exports from Africa to the rest of the world"
13 May 2019: IMF inflation estimates for various African countries including SA
In this update we take a look at the IMF's estimate of annual inflation for selected African countries including South Africa. The countries we will be looking at are:
The line chart below shows the IMF's average annual inflation for the countries mentioned above.
- Botswana
- Ethiopia
- Kenya
- Namibia
- Nigeria
- South Africa
The line chart below shows the IMF's average annual inflation for the countries mentioned above.
Of the six countries looked at Nigeria is expected to have the highest average annual inflation rate from 2018 up to 2024, with their average annual inflation expected to be at 11.5% while Botswana's inflation rate is expected to be the lowest at 3.8%. The summary below shows the average annual inflation expected by the IMF for the six countries looked at (ranked from lowest expected annual inflation to highest).
South Africa and their norther border neighbor Namibia is expected to have very similar annual levels of inflation over the next couple of years, with Nigeria and Ethiopia expected to have inflation levels far higher than those of Botswana, Kenya, South Africa and Namibia.
- Botswana: 3.8%
- Kenya: 4.9%
- South Africa: 5.3%
- Namibia: 5.3%
- Ethiopia: 9.0%
- Nigeria: 11.5%
South Africa and their norther border neighbor Namibia is expected to have very similar annual levels of inflation over the next couple of years, with Nigeria and Ethiopia expected to have inflation levels far higher than those of Botswana, Kenya, South Africa and Namibia.
9 October 2018: South Africa's growth estimates vs rest of Africa
According to IMF estimates South Africa's annual real GDP growth rate (year on year growth after effects of inflation has been removed), is lagging behind that of its African peers. The image below shows a broad forecast of the annual GDP growth rates expected for the various African countries during 2019.
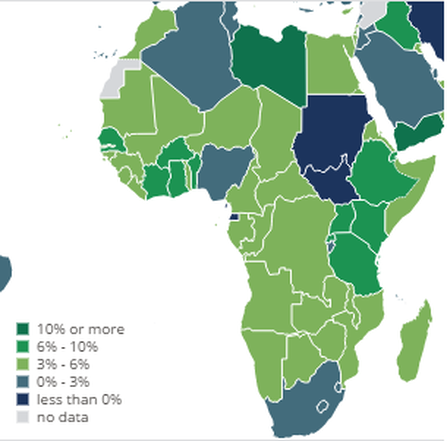
Sadly for South Africa, the predict growth rate is between 0% and 3% while a large chunk of other African countries have predicted growth rates of between 3% and 10%. And this is where South Africa needs to be at in order to reduce its persistently high levels of unemployment. Jobs summits wont create jobs, strong economic growth set about by robust and business friendly economic policies will create growth and jobs. The table below shows the average growth rate predicted for South Africa and various regions within the African continent.
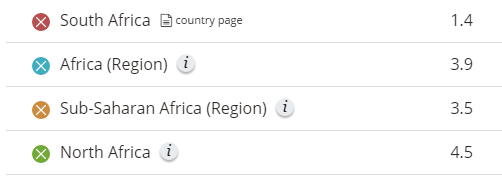
South Africa's annual real GDP growth rate is predicted to be around 1.4% in 2019, while Africa as a whole is predicted to grow by 3.9%, Sub-Saharan Africa is predicted to grow by 3.5% and North Africa is predicted to grow at 4.5% during 2019. The country at the southern most tip of Africa is falling behind. And its falling behind very quickly.
15 July 2018: South Africa's trade balance with other African countries
We take a look at customs data showing South Africa's trade balance (the difference between exports and imports), for the time period January 2018 to May 2018 with other African countries. While South Africa is the main benefactor of trade with other African countries (by having a positive trade balance) South Africa do have a negative trade balance with a few countries. And this is largely due to the fact that South Africa imports crude from these counties. The graphic below shows the trade balance South Africa has with other African countries in descending order. From highest positive trade balance, which is with Botswana, to most negative trade balance, which is with Nigeria.
The total trade balance South Africa has with all African countries from January 2018 to May 2018 amounted to R68 904 013 615 . So South Africa exported R68.9 billion more to African countries than what they imported from South African countries. The summary below shows the trade balance per product type:
- Live animals: R 395 046 169
- Vegetables: R 4 279 308 984
- Animal or vegetable fats: R 1 207 826 916
- Prepared foodstuffs: R 8 114 924 503
- Mineral Products: -R10 333 633 831
- Chemicals: R 9 881 221 353
- Plastics & Rubber: R 6 663 796 861
- Raw hides & leather: R 192 020 652
- Wood Products: R 529 158 755
- Wood pulp & paper: R 2 282 123 582
- Textiles: R -174 008 296
- Footwear: R 705 620 555
- Stone & Glass: R 1 416 038 005
- Precious Metal: -R1 448 350 870
- Products Iron & Steel: R 12 094 731 692
- Machinery: R 18 601 745 371
- Vehicles aircraft & vessels: R 10 630 189 404
- Photographic & medical equipment: R 1 645 993 950
- Toys & Sport apparel: R 2 369 661 242
- Works of art: -R214 986 095
- Other unclassified goods: R 91 580 546
- Equipment Components: -R25 995 833
- Total: R 68 904 013 615
9 July 2018: SA's actual and forecasted growth rates compared to other African countries
In our first update of this new page we take a look at South Africa's annual GDP growth rate and compared it to some of the other big economies in Africa, and the growth rates achieved and forecasted growth rates for South Africa looks extremely lack luster when compared to some of the other countries in this comparison. The other African countries included in this comparison are:
- Angola
- Botswana
- Egypt
- Ghana
- Kenya
- Nigeria
- South Africa
Based on data from the International Monetary Fund (IMF), South Africa is the third biggest economy in Africa using 2015 GDP data and looking at Purchasing power parity (PPP). Nigeria is Africa's biggest economy, closely followed by Egypt, with South Africa coming in, in third place and Algeria and Morocco round out the top 5 biggest economies in Africa,
So what are the IMF predictions like for the countries mentioned at the start of this update? Well the graphic above shows the predicted growth rates from 2017 up to 2023, and for South Africa and Nigeria the forecasts looks rather bleak. While for Kenya, Egypt, Ghana and Angola the predicted growth rates looks pretty solid. The summary below shows the average forecasted economic growth rates per year from 2017 to 2023 based on the IMF forecasts. The list is sorted based on highest average annual economic growth rate to lowest predicted average annual growth rates.
So what are the IMF predictions like for the countries mentioned at the start of this update? Well the graphic above shows the predicted growth rates from 2017 up to 2023, and for South Africa and Nigeria the forecasts looks rather bleak. While for Kenya, Egypt, Ghana and Angola the predicted growth rates looks pretty solid. The summary below shows the average forecasted economic growth rates per year from 2017 to 2023 based on the IMF forecasts. The list is sorted based on highest average annual economic growth rate to lowest predicted average annual growth rates.
- Kenya (5.93%)
- Ghana (5.89%)
- Egypt (5.53%)
- Botswana (4.02%)
- Angola (3.26%)
- Nigeria (1.84%)
- South Africa (1.68%)
- Ghana (7.16%)
- Kenya (5.98%)
- Botswana (5.31%)
- Nigeria (4.74%)
- Angola (3.75%)
- Egypt (3.43%)
- South Africa (2.10%)