South African Market Insights
  • Home
  • Blog
    • Blog-5Jun2018
    • Blog-18May2018
    • Blog-16May2018
    • Blog-3May2018
    • Blog-2May2018
    • Blog-30Apr2018
    • Blog-26Apr2018
    • Blog-24Apr2018
    • Blog-18Apr2018
    • Blog-17Apr2018
    • Blog-16Apr2018
    • Blog-3Apr2018
    • Blog-22Mar2018
    • Blog-20Mar2018
    • Blog-19Mar2018
    • Blog-23Oct2017
    • Blog-20Oct2017
    • Blog-11Oct2017
    • Blog-10Oct2017
    • Blog-6Oct2017
    • Blog-3Oct2017
    • Blog-2Oct2017
  • Economics
    • Rand Dollar Exchange Rate
    • South Africa's GDP
    • South Africa's Unemployment
    • SA by numbers
    • Economic Progress Index
    • Taylors Rule
    • South Africa's Formal Business Sector
    • South-Africa's-Fiscal-Policy
    • SA EU Trade Data
    • Inflation Heat Map
    • Population Density Map
    • Labour Market Dynamics
    • Estimating the Size of the Informal Economy
    • SA Consumer Spending Patterns
    • South Africa's Monetary Fiscal Policy Mix
    • GDP Animations >
      • SouthAfrica
      • WesternCape
      • EasternCape
      • NorthernCape
      • FreeState
      • KwaZuluNatal
      • NorthWest
      • Gauteng
      • Mpumalanga
      • Limpopo
    • South Africa's Economic Structure
    • South Africa's Economic History
    • South Africa's Trade Data Page
    • South Africa's Food and Beverages Sector
    • Financial Well-being of South African Companies_2015
    • SA vs the World
    • Budget Day Page (24 Feb 2016)
  • Stock in Focus
    • JSE ALSI Chart
    • Sector Comparison Page
    • JSE-Calendar-Tracker-2019
    • Adcorp (ADR)
    • Amazon (AMZN)
    • Apple (AAPL)
    • Ascendis (ASC)
    • AVI (AVI)
    • Bidvest (BVT)
    • Blue Label Telecoms (BLU)
    • Bowler Metcalf (BCF)
    • Capitec (CPI)
    • City Lodge Hotel Group
    • Clicks Group (CLS)
    • Coronation (CML)
    • Curro Holdings (COH)
    • Discovery (DSY)
    • Distell (DST)
    • EOH (EOH)
    • Famous Brands (FBR)
    • Ferrari (RACE)
    • FirstRand Group (FSR)
    • Grindrod (GND)
    • GrowthPoint (GRT)
    • Holdsport (HSP)
    • Harley-Davidson (HOG)
    • Hyprop (HYP)
    • Hyprop (HYP)_1Jun2016
    • Investec Property Fund (IPF)
    • JSE (JSE)
    • Massmart (MSM)
    • MediClinic (MEI)
    • MTN (MTN)
    • MTN (MTN)_May2016
    • Mr Price Group (MRP)
    • Mr Price Group (MRP)_8APR2016
    • Nedbank (NED)
    • OneLogix (OLG)
    • Peregrine Holdings (PGR)
    • Pick 'n Pay Stores (PIK)
    • Pioneer Foods (PFG)
    • PSG Group (PSG)
    • Quantum Foods (QFH)
    • RCL Foods (RCL)
    • Remgro (REM)
    • Richemont (CFR)
    • RMB Holdings (RMH)
    • Rolfes (RLF)
    • Sanlam (SLM)
    • Sasol (SOL)
    • Sasol (SOL)_18sep2016
    • Santova (SNV)
    • Spar Group (SPP)
    • Shoprite Holdings (SHP)
    • Spur Corporation (SUR)_7Sep2017
    • Standard Bank (SBK)
    • Steinhoff International Holdings (SNH)
    • Stor-Age (SSS)
    • Super Group (SPG)
    • Taste Holdings (TAS)_30May2016
    • The Foshini Group (TFG)
    • Value Logistics (VLE)
    • Vodacom (VOD)
    • Wilson Bayly Holmes Ovcon (WBO)
    • Woolworths (WHL)
    • Woolworths (WHL)_24Aug2017
    • Zeder (ZED)
  • Online Calculators
    • Rand Petrol Price Estimator
    • Share Valuation
    • Financial Ratios Calculator
    • GDP Growth Estimator
    • Future Value of Investment Calculator
    • Loan repayment calculator
  • Contact
  • About
  • Search

< What the Big Mac index says about the value of the rand
Economics Main Page >

South African exports leaving SA per district office
​​​​
​Date: 30 July 2018
Category: Economics

Related Topics

We take a look at South Africa's economic growth rate and compare it to the growth in the Baltic Dry Shipping Index (BDI), which is used as a proxy for measuring dry freight shipped across the globe. The reason we are looking at this index and South Africa's economic growth is the fact that South Africa is a very open economy, with imports and exports amounting to roughly 60% of South Africa's total GDP. Just showing how dependent South Africa's economy is on international trade. And if the Baltic shipping index is to slow down, it might indicate less international trade and slow downs in international economies and could therefore be a leading indicator of future economic activity in South Africa
Picture
  • SA monetary fiscal policy mix
  • ​SA's trade data page

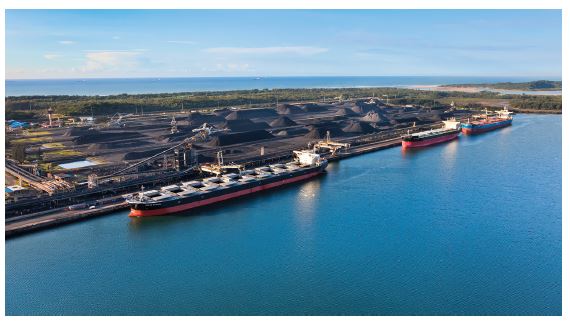
Richards bay the customs office that processes the largest value of SA exports

From the graphic below it is clear that Richards Bay processed the largest value of South African exports for March 2018. It is not a surprise though as coal is currently South Africa's single biggest export and Richards Bay has a whole coal terminal set up just to handle and process and exports large volumes of coal from South Africa to other countries (in particular India). There is massive demand in India for coal from South Africa.
chart created with amCharts | amCharts
The second biggest exit point of exported goods out of South Africa is Durban, with R13 billion worth of goods leaving SA shores via Durban harbour in March 2018. The third biggest exit point for South African goods is OR Tambo international airport with R12.9 billion worth of goods leaving South Africa via OR Tambo. The summary below shows the Rand value of goods that left South Africa in March 2018:
  • Richards Bay: R 13 728 800 000
  • Durban: R 13 062 800 000
  • O.R. Tambo Int Airport: R 12 989 400 000
  • Cape Town: R 7 257 912 548
  • Port Elizabeth: R 7 166 152 856
  • Sa Reserwebank: R 7 099 099 883
  • Saldanha Bay: R 4 696 490 445
  • Beit Bridge: R 4 277 523 267
  • Komatipoort: R 4 003 496 480
  • East London: R 3 871 837 112
  • Kopfontein: R 2 489 216 757
  • Johannesburg: R 2 437 132 219
  • Pretoria: R 2 373 576 978
  • Skilpadshek: R 2 279 083 872
  • Groblers Bridge: R 1 942 562 780
  • Germiston/Alberton: R 1 432 297 032
  • Narogas: R 1 241 240 335
  • Maseru Bridge: R 926 902 204
  • Oshoek: R 867 877 603
  • Vioolsdrif: R 865 460 788
  • Cape Town Int Airport: R 826 101 361
  • Golela: R 549 579 571
  • Ramatlabama: R 421 340 984
  • Paarl: R 341 000 554
  • Ficksburg Bridge: R 230 434 976
  • Pez Inter Airport: R 216 204 688
  • King Shaka Int Airport: R 192 820 983
  • Caledonspoort: R 185 420 532
  • Van Rooyenshek: R 62 693 355
  • Mahamba: R 60 557 817
  • Pietermaritzburg: R 60 064 962
  • Mananga: R 47 672 236
  • Jeppes Reef: R 34 635 114
  • Upington: R 12 659 539
  • Worcester: R 12 247 485
  • Mosselbay: R 9 804 813
  • Qachasnek: R 7 693 411
  • Nerston: R 4 530 742
  • Bloemfontein: R 2 364 906
  • Stellenbosch: R 388 307
  • Oudtshoorn: R 18 535

So while its nice to know where goods leave South Africa from. The question is, by what modality is it? Does it leave South Africa's borders by land, sea or air? The pie chart below shows the value and percentage of exports in March 2018 per modality.
chart created with amCharts | amCharts
The pie chart above shows that the majority of goods leaving South Africa's borders do so via Sea, with just over 50% of all of South Africa's exports leaving it by sea, then land with around 27% (this is largely exports from South Africa heading to BLNS (Botswana, Lesotho, Namibia and Swaziland) countries and South Africa's neighbours (such as Zimbabwe and Mozambique. The summary belows shows the proportion each of the modalities make up to total South African exports.
  • Sea: R 49 793 800 000
  • Land: R 26 355 800 000
  • Air: R 14 224 500 000
  • Other: R 7 912 990 852


Newsletter Subscription

    Please enter your email address below to subscribe to our newsletter. It will be ad hoc newsletters and we wont bombard your email inbox with emails. We will NEVER supply your contact details to any third party.

Subscribe to Newsletter

Additional content

Related Topics

  • SA monetary fiscal policy mix
  • ​SA's trade data page​


​Homepage

Economics Page
Stock in Focus Page


​About


Contact Us

Copyright © 2015
  • Home
  • Blog
    • Blog-5Jun2018
    • Blog-18May2018
    • Blog-16May2018
    • Blog-3May2018
    • Blog-2May2018
    • Blog-30Apr2018
    • Blog-26Apr2018
    • Blog-24Apr2018
    • Blog-18Apr2018
    • Blog-17Apr2018
    • Blog-16Apr2018
    • Blog-3Apr2018
    • Blog-22Mar2018
    • Blog-20Mar2018
    • Blog-19Mar2018
    • Blog-23Oct2017
    • Blog-20Oct2017
    • Blog-11Oct2017
    • Blog-10Oct2017
    • Blog-6Oct2017
    • Blog-3Oct2017
    • Blog-2Oct2017
  • Economics
    • Rand Dollar Exchange Rate
    • South Africa's GDP
    • South Africa's Unemployment
    • SA by numbers
    • Economic Progress Index
    • Taylors Rule
    • South Africa's Formal Business Sector
    • South-Africa's-Fiscal-Policy
    • SA EU Trade Data
    • Inflation Heat Map
    • Population Density Map
    • Labour Market Dynamics
    • Estimating the Size of the Informal Economy
    • SA Consumer Spending Patterns
    • South Africa's Monetary Fiscal Policy Mix
    • GDP Animations >
      • SouthAfrica
      • WesternCape
      • EasternCape
      • NorthernCape
      • FreeState
      • KwaZuluNatal
      • NorthWest
      • Gauteng
      • Mpumalanga
      • Limpopo
    • South Africa's Economic Structure
    • South Africa's Economic History
    • South Africa's Trade Data Page
    • South Africa's Food and Beverages Sector
    • Financial Well-being of South African Companies_2015
    • SA vs the World
    • Budget Day Page (24 Feb 2016)
  • Stock in Focus
    • JSE ALSI Chart
    • Sector Comparison Page
    • JSE-Calendar-Tracker-2019
    • Adcorp (ADR)
    • Amazon (AMZN)
    • Apple (AAPL)
    • Ascendis (ASC)
    • AVI (AVI)
    • Bidvest (BVT)
    • Blue Label Telecoms (BLU)
    • Bowler Metcalf (BCF)
    • Capitec (CPI)
    • City Lodge Hotel Group
    • Clicks Group (CLS)
    • Coronation (CML)
    • Curro Holdings (COH)
    • Discovery (DSY)
    • Distell (DST)
    • EOH (EOH)
    • Famous Brands (FBR)
    • Ferrari (RACE)
    • FirstRand Group (FSR)
    • Grindrod (GND)
    • GrowthPoint (GRT)
    • Holdsport (HSP)
    • Harley-Davidson (HOG)
    • Hyprop (HYP)
    • Hyprop (HYP)_1Jun2016
    • Investec Property Fund (IPF)
    • JSE (JSE)
    • Massmart (MSM)
    • MediClinic (MEI)
    • MTN (MTN)
    • MTN (MTN)_May2016
    • Mr Price Group (MRP)
    • Mr Price Group (MRP)_8APR2016
    • Nedbank (NED)
    • OneLogix (OLG)
    • Peregrine Holdings (PGR)
    • Pick 'n Pay Stores (PIK)
    • Pioneer Foods (PFG)
    • PSG Group (PSG)
    • Quantum Foods (QFH)
    • RCL Foods (RCL)
    • Remgro (REM)
    • Richemont (CFR)
    • RMB Holdings (RMH)
    • Rolfes (RLF)
    • Sanlam (SLM)
    • Sasol (SOL)
    • Sasol (SOL)_18sep2016
    • Santova (SNV)
    • Spar Group (SPP)
    • Shoprite Holdings (SHP)
    • Spur Corporation (SUR)_7Sep2017
    • Standard Bank (SBK)
    • Steinhoff International Holdings (SNH)
    • Stor-Age (SSS)
    • Super Group (SPG)
    • Taste Holdings (TAS)_30May2016
    • The Foshini Group (TFG)
    • Value Logistics (VLE)
    • Vodacom (VOD)
    • Wilson Bayly Holmes Ovcon (WBO)
    • Woolworths (WHL)
    • Woolworths (WHL)_24Aug2017
    • Zeder (ZED)
  • Online Calculators
    • Rand Petrol Price Estimator
    • Share Valuation
    • Financial Ratios Calculator
    • GDP Growth Estimator
    • Future Value of Investment Calculator
    • Loan repayment calculator
  • Contact
  • About
  • Search