|
Related Topics |
|
We take a look at the interim results for the period ending end of September 2018 of one of South Africa's largest listed companies, Richemont, who is active in the luxury goods space and owns some of the world's most well known luxury goods brands.
|

|
About Richemont (CFR)
Richemont owns several of the world's leading companies in the field of luxury goods, with particular strengths in jewellery, watches and writing instruments. Our Maisons™ encompass several of the most prestigious names in the luxury industry including Cartier, Van Cleef & Arpels, IWC Schaffhausen, Jaeger-LeCoultre, Officine Panerai, Piaget, Vacheron Constantin, Montblanc, Alfred Dunhill and Chloé. Richemont also owns leading online distributors YOOX NET-A-PORTER GROUP and Watchfinder.co.uk.

Compagnie Financière Richemont SA is the ultimate holding Company for some of the world’s leading luxury goods companies - its Maisons - encompassing jewellery, watches, premium accessories and other luxury products. The Group is managed with the objective of growing value for shareholders over the long-term, recognising that the most important assets of the Group - its Maisons - have almost all been in existence for over a century.
The independence of each Maison within the Group is fundamental to Richemont’s overall growth strategy. Each Maison focuses on increasing awareness and desirability by developing creative products and appropriate marketing programmes. The Maisons’ products are sold through a network of boutiques owned by the Group, through franchise operations and through boutiques owned by third parties.
The Group’s luxury businesses operate globally. Details of sales by geographic region are given on the Key Figures page. The Group believes the diversity of its geographical operations, with a lack of dependency on any one market, represents a long-term competitive advantage.
Specifically, the Group’s strategic objectives are:
- for long term organic growth through investment in Maisons
- to maintain high product quality and outstanding customer service
- to attract and retain creative management and skilled craftsmen
- to increase investments in manufacturing (R&D, integration, flexibility and capacity)
- to adapt the selective distribution model to changes in the environment
- to maintain long-standing commitment to doing business responsibly
- to further enhance our business model (shared services / platforms / ERP) allowing leverage and control
So to the numbers we go
- Sales: Euro 6.6 billion up 21% from Euro 5.62 billion from the prior year
- Gross profit: Euro 4.26billion up 16% from Euro 3.68 billion from the prior year
- Gross margin: 62.5% down from 65.5% from the prior year
- Operating profit: Euro 1.13 billion down -3% from Euro 1.116 from the prior year
- Operating margin: 16.6% down 410 basis points from 20.7% in the prior year
- Cash flow generated from operations Eur0 733million down 34% from Euro 1.11 billion in the prior year
- Net cash position: Euro 1.5 billion down Euro 3 billion from Euro 4.6 billion in the prior year
- Diluted headline earnings per share: Euro 1.649 (down 6.7% from Euro 1.767)
So any comments from management on the results?
The following is the Chairman's report (Chairman is Johann Rupert) on their financial results
"During the past six months, Richemont strengthened its portfolio with two strategic investments aimed at offering our discerning and globally dispersed clientele more options in how, when and where they engage with and purchase from our Maisons. We now fully own YOOX NET-A-PORTER, the leading online luxury retailer, and Watchfinder, a leading omni-channel platform for premium pre-owned timepieces. As part of the continual assessment of our portfolio, we divested Lancel. These strategic changes have had a material impact on our operating profit and net cash position in the period under review. Serving our customers is our priority. At the same time, Richemont will ensure that YNAP remains committed to offering brand partners and their clients the best service and we are determined that YNAP remains the neutral, open and compelling go-to destination for online luxury. More recently, on 26 October 2018, we announced a strategic partnership with Alibaba Group, the preferred online marketplace for Chinese consumers, aiming at becoming a significant and sustainable online destination in luxury shopping for the important Chinese clientele.
YNAP and Alibaba will establish a joint venture to bring the in-season offerings of YNAP to Chinese consumers, be it in China or whilst travelling abroad. This new chapter in the history of Richemont reflects the potential we see in China and the confidence we have in Alibaba with whom we share an ambition to set new standards for the future of luxury online, for the benefit of YNAP's brand partners and customers as well as our Maisons and their clients. Over the six month period ended 30 September 2018, sales increased by 21% at actual rates to EUR 6.81 billion. Excluding YNAP and Watchfinder, collectively the Online Distributors, sales for the period grew by 6% at actual exchange rates and by 8% at constant exchange rates. Excluding Online Distributors, sales growth was primarily driven by strong performance of the Jewellery Maisons and double digit increases in the Maisons' directly operated boutiques and online stores. Robust retail sales in jewellery and watches more than offset a 2% decline in wholesale sales, which was mainly due to the Specialist Watchmakers' ongoing prudent inventory management and upgrade of the wholesale distribution network. Excluding Online Distributors, all regions with the exception of Middle East and Africa enjoyed higher sales, with notable double digit increases in Hong Kong, Korea and the USA."
"In our Jewellery Maisons, watch sales grew strongly in Cartier's stores, benefiting from the successful Panthère and relaunched Santos collections. Jewellery pieces continued to outperform, notably with the iconic Cartier Love and Van Cleef and Arpels Alhambra collections. The muted sales growth of the Specialist Watchmakers reflected the previously mentioned initiatives. Here, retail was strong and overall there was good momentum at Vacheron Constantin, Roger Dubuis and Jaeger-LeCoultre. Most of our Maisons grouped under 'Other' saw higher sales, led primarily by Montblanc and Peter Millar. The 3% reduction in operating profit to EUR 1.13 billion reflected an increase in costs which more than offset the improvement in gross profit. These higher costs were primarily attributable to the first-time consolidation of Online Distributors and their related acquisition charges as well as disposal-related charges. The operating margin decreased to 16.6%, but improved to 21.1% excluding Online Distributors. Profit for the period rose to EUR 2.25 billion, primarily due to a post-tax non-cash gain of EUR 1.38 billion on the revaluation of existing YNAP shares.
Net cash amounted to EUR 1.58 billion at 30 September 2018 after a EUR 3.75 billion cash outflow related to the YNAP and Watchfinder acquisitions and dividend payment. Richemont's governance structure continued to evolve with the appointments of Mr Jérôme Lambert to the role of Group Chief Executive Officer and Mr Eric Vallat to the newly created role of Head of Fashion and Accessories Maisons. Amidst growing volatility in consumer demand, partly attributable to an uncertain economic and geopolitical environment, we maintain confidence in our ability to realise our long term ambitions, supported by the strength of our balance sheet. Our ambition remains to ensure that we continue to create, manufacture and sell exquisite products with a high level of beauty, craftsmanship, patrimony and passion while maintaining continued engagement, relevance and appeal for our clients. "
The table below shows the breakdown of CFR's sales by region
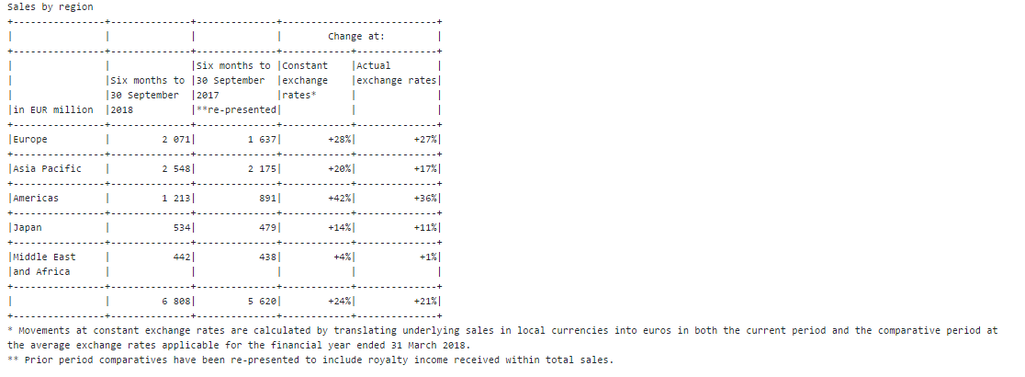
Sales growth in the America's region was extremely strong. With sales increasing 42% at constant exchange rates, Europe also showed strong sales growth with 28% growth in constant exchange rate sales. Asia pacific grew by 20% and Japan by 14%, while the Middle East and Africa struggled with growth coming in at just 4%. The pie chart below shows the contribution of various regions and countries to CFR's overall sales for the 6 months ended September 2018.
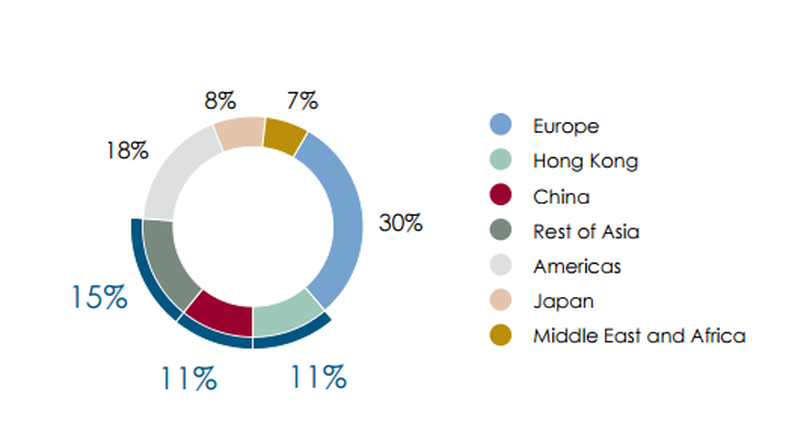
Pie chart showing the contribution of various regions and countries to Richemont's sales
The pie chart shows just how significant Hong Kong and China's contribution to total sales of the Richemont group is. China and Hong Kong alone accounts for about 22% of Richemont's sales. So about a fifth of their sales revenue comes from these two alone. The image below shows a pie chart which shows the relative contribution CR's various distribution channels to total sales.
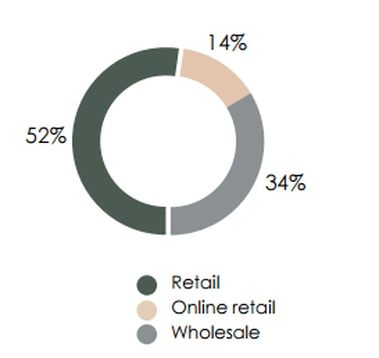
Richemont distribution channels contribution to total sales
The pie chart above shows that while retail makes up 52% of total sales for the group, Wholesale 34%, the new kid on the block, online retail already contributes 14% of CFR's sales. And with the tie up with Alibaba it is sure to see online retail contibute even more to CFR's sales in future. So which products sold by CFR contributed the most to their sales during the 6 months? The pie chart below shows the relative contribution of various product lines of Richemont to total sales of the group.
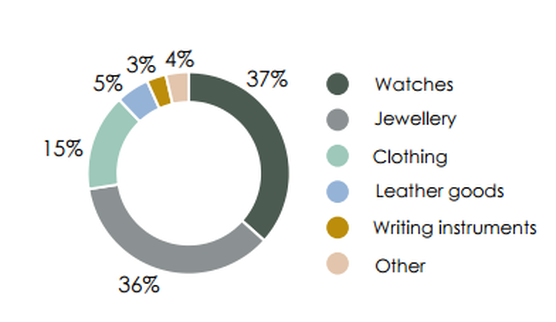
Richemont product groups contribution to total sales
From the pie chart it is clear that the major products sold by CFR are watches and jewellery, with these two products contributing 73% of the group's total sales during the 6 months period ending September 2018. A full summary of the product contributions to total sales:
- Watches: 37%
- Jewellery:36%
- Clothing:15%
- Leather Goods: 5%
- Writing instruments: 3%
- Other: 4%
So should you buy their shares?
Well based on the current results they are trading on a PE ratio of around 18.65 (based on headline earnings per depository receipt of R2.60) per share for the 6 months ended September 2018. The PE is around the overall market average, perhaps slightly above it, but investors should note their product offering caters for the very rich, who hardly ever experience "recessions" and a draw back in spending. Thus there will always be demand for their goods. Richemont also provides South Africa's with a Rand hedge, as a large chunk of their earnings are earned outside of the borders of South Africa. Which covers investors in terms of South African economic and exchange rate risks.
We also believe the joint venture with Alibaba will benefit Richemont greatly and we foresee strong growth in their earnings from the Asia pacific region in years to come. As more and more Chinese millionaires are created and gets access to Richemont products more easily.
We also believe the joint venture with Alibaba will benefit Richemont greatly and we foresee strong growth in their earnings from the Asia pacific region in years to come. As more and more Chinese millionaires are created and gets access to Richemont products more easily.
Valuation of Richemont
Based on our valuation models,w e value CFR at R109 a share, which places them on a PE ratio of just over 21, which is well above market average but we believe their products as well as geographical representation is worth paying a bit of premium over the market for