South African Market Insights
  • Home
  • Blog
    • Blog-5Jun2018
    • Blog-18May2018
    • Blog-16May2018
    • Blog-3May2018
    • Blog-2May2018
    • Blog-30Apr2018
    • Blog-26Apr2018
    • Blog-24Apr2018
    • Blog-18Apr2018
    • Blog-17Apr2018
    • Blog-16Apr2018
    • Blog-3Apr2018
    • Blog-22Mar2018
    • Blog-20Mar2018
    • Blog-19Mar2018
    • Blog-23Oct2017
    • Blog-20Oct2017
    • Blog-11Oct2017
    • Blog-10Oct2017
    • Blog-6Oct2017
    • Blog-3Oct2017
    • Blog-2Oct2017
  • Economics
    • Rand Dollar Exchange Rate
    • South Africa's GDP
    • South Africa's Unemployment
    • SA by numbers
    • Economic Progress Index
    • Taylors Rule
    • South Africa's Formal Business Sector
    • South-Africa's-Fiscal-Policy
    • SA EU Trade Data
    • Inflation Heat Map
    • Population Density Map
    • Labour Market Dynamics
    • Estimating the Size of the Informal Economy
    • SA Consumer Spending Patterns
    • South Africa's Monetary Fiscal Policy Mix
    • GDP Animations >
      • SouthAfrica
      • WesternCape
      • EasternCape
      • NorthernCape
      • FreeState
      • KwaZuluNatal
      • NorthWest
      • Gauteng
      • Mpumalanga
      • Limpopo
    • South Africa's Economic Structure
    • South Africa's Economic History
    • South Africa's Trade Data Page
    • South Africa's Food and Beverages Sector
    • Financial Well-being of South African Companies_2015
    • SA vs the World
    • Budget Day Page (24 Feb 2016)
  • Stock in Focus
    • JSE ALSI Chart
    • Sector Comparison Page
    • JSE-Calendar-Tracker-2019
    • Adcorp (ADR)
    • Amazon (AMZN)
    • Apple (AAPL)
    • Ascendis (ASC)
    • AVI (AVI)
    • Bidvest (BVT)
    • Blue Label Telecoms (BLU)
    • Bowler Metcalf (BCF)
    • Capitec (CPI)
    • City Lodge Hotel Group
    • Clicks Group (CLS)
    • Coronation (CML)
    • Curro Holdings (COH)
    • Discovery (DSY)
    • Distell (DST)
    • EOH (EOH)
    • Famous Brands (FBR)
    • Ferrari (RACE)
    • FirstRand Group (FSR)
    • Grindrod (GND)
    • GrowthPoint (GRT)
    • Holdsport (HSP)
    • Harley-Davidson (HOG)
    • Hyprop (HYP)
    • Hyprop (HYP)_1Jun2016
    • Investec Property Fund (IPF)
    • JSE (JSE)
    • Massmart (MSM)
    • MediClinic (MEI)
    • MTN (MTN)
    • MTN (MTN)_May2016
    • Mr Price Group (MRP)
    • Mr Price Group (MRP)_8APR2016
    • Nedbank (NED)
    • OneLogix (OLG)
    • Peregrine Holdings (PGR)
    • Pick 'n Pay Stores (PIK)
    • Pioneer Foods (PFG)
    • PSG Group (PSG)
    • Quantum Foods (QFH)
    • RCL Foods (RCL)
    • Remgro (REM)
    • Richemont (CFR)
    • RMB Holdings (RMH)
    • Rolfes (RLF)
    • Sanlam (SLM)
    • Sasol (SOL)
    • Sasol (SOL)_18sep2016
    • Santova (SNV)
    • Spar Group (SPP)
    • Shoprite Holdings (SHP)
    • Spur Corporation (SUR)_7Sep2017
    • Standard Bank (SBK)
    • Steinhoff International Holdings (SNH)
    • Stor-Age (SSS)
    • Super Group (SPG)
    • Taste Holdings (TAS)_30May2016
    • The Foshini Group (TFG)
    • Value Logistics (VLE)
    • Vodacom (VOD)
    • Wilson Bayly Holmes Ovcon (WBO)
    • Woolworths (WHL)
    • Woolworths (WHL)_24Aug2017
    • Zeder (ZED)
  • Online Calculators
    • Rand Petrol Price Estimator
    • Share Valuation
    • Financial Ratios Calculator
    • GDP Growth Estimator
    • Future Value of Investment Calculator
    • Loan repayment calculator
  • Contact
  • About
  • Search

< What the Big Mac index says about the value of the rand
Economics Main Page >

South African Rand might be weak but its not performing as badly as some of the other emerging market economy currencies
​

Category: Currencies and emerging markets
Date: 5 July 2018

Related Topics

In today's update we take a look at various currencies performance against the United States Dollar (USD) since the start of 2018. Sure the South African Rand is performing like a donkey in a horse race against the dollar, but its not as bad as some of its emerging market peers. We take a detailed look below.

Thanks to our good friends at PSG for supplying us with the currency data so that we are able to develop the graphic below. 

The currencies we will look at are:
  • South African Rand
  • Turkish Lira
  • Mexican Peso
  • Brazilian Real
  • Chilean Peso

For more details or news click here.

Picture
  • JSE market stats (11 June 2018)
  • ​Rand Dollar Exchange Rate

How bad is Rand really doing against the Dollar?

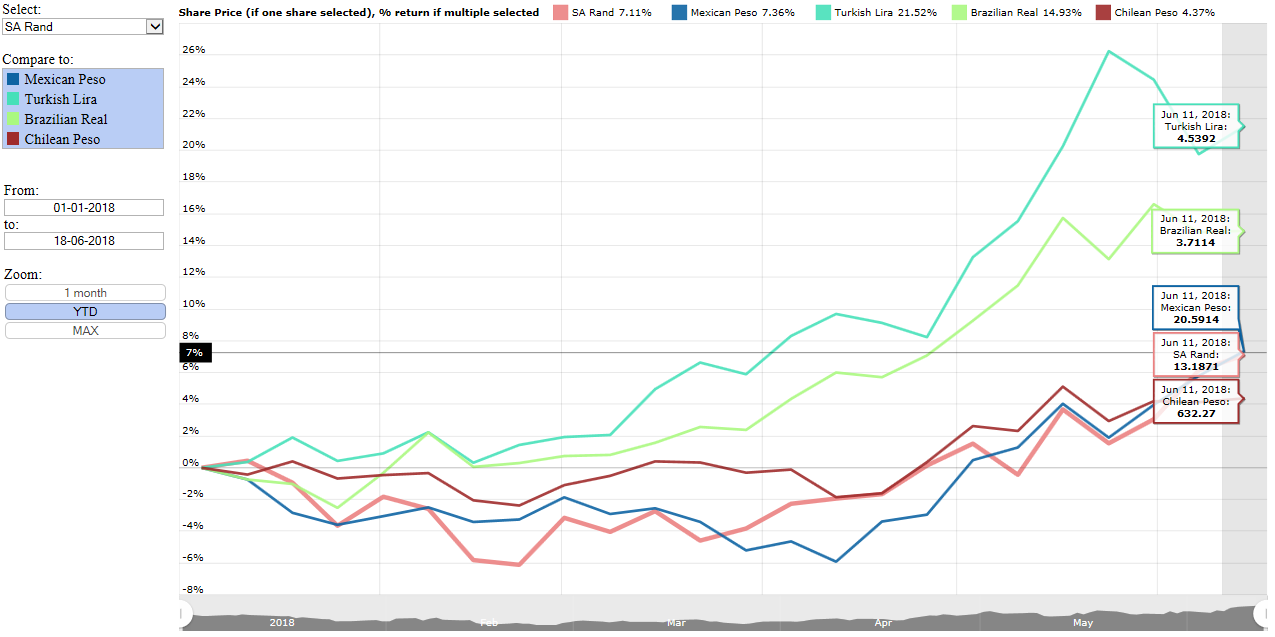
See the interactive graphic below for detailed performances of the various currencies performance against the US dollar. Positive percentage shows  a depreciation/weakening of a currency against the US dollar while negative percentages shows a strengthening/appreciation  of a currency against the US dollar.

Well since the start of 2018, the Rand has lost 10.6% of its value against the US dollar. Basically South Africans will by 10.6% more per US Dollar now than what they would have paid for it at the start of 2018. While this is not good news, especially not for our local inflation numbers (as we import a large number of goods we consume (especially crude oil for fuel), our currency is still holding its value a lot better than some of our emerging market peers.
The image below takes a look at the aforementioned currencies performance over the last month.  And sadly for South Africans the Rand is the worst performing currency of the bunch over the last month, with it losing close to 5% to the US dollar. The summary below provides details on all the above listed currencies performance against the dollar over the last month (positive percentages indicates the currency lost ground against the US dollar while a negative value shows the specific currency strengthened (appreciated) against the US dollar:
  • Mexican Peso: -5.6%
  • Brazilian Real: 02%
  • Turkish Lira: 3.1%
  • Chilean Peso: 3.3%
  • South African Rand: 4.9%
Picture
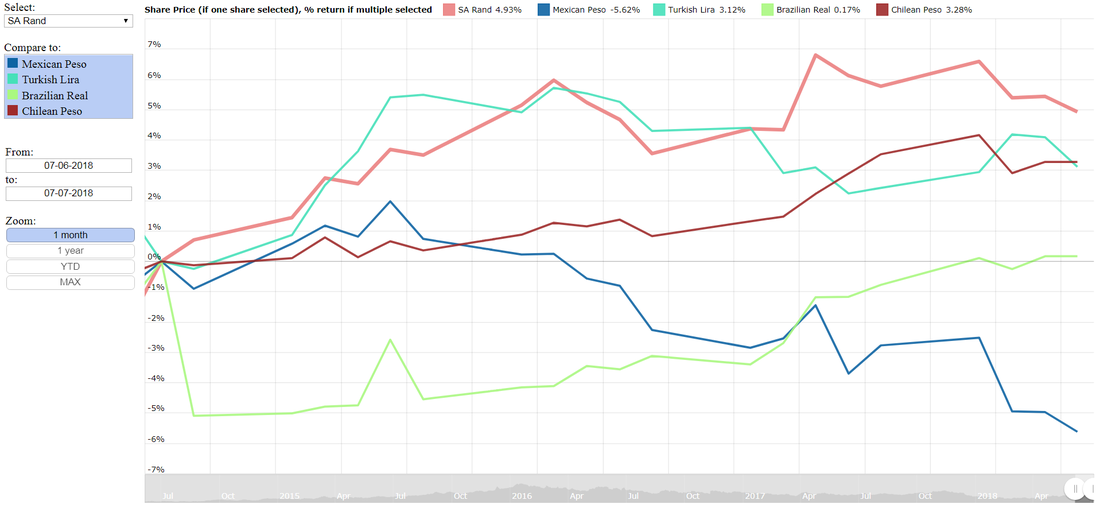
So all the currencies looked at only the Mexican Peso has gained ground against the US dollar, and speculation of a potential Mexican president who is following a Donald Trump ("America first") approach with his own version of a ("Mexico first") message being told to the Mexican public it seems talking tough by Mexican presidential hopefuls has boosted the country's currency a bit.  But how has these currencies performed against the US dollar since the start of the year? The image below shows the performance of these currencies since the start of 2018.
Picture
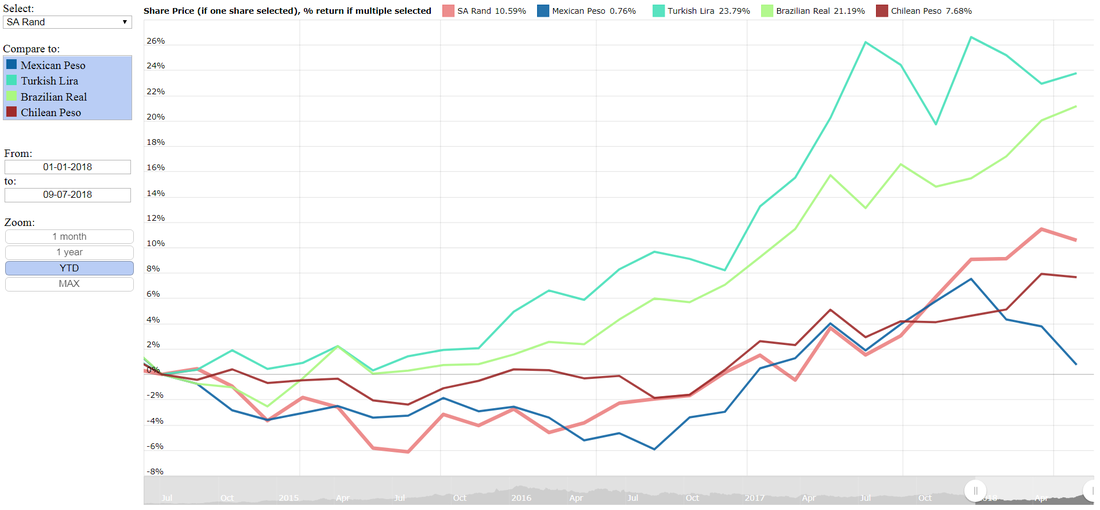
The image above shows that it has not been Turkey's year. Political turmoil and worries about the powers the president of Turkey has basically bestowed upon himself has markets and investors running for the hills and dumping the currency faster than Donald Trump can send out tweets. Below the performance of the currencies from the start of 2018:
  • Mexican Peso: 0.76%
  • Chilean Peso: 7.7%
  • South African Rand: 10.59%
  • Brazilian Real: 21.2%
  • Turkish Lira: 23.8%

So while the Rand has not had a great year against the US dollar, it is lying in the middle of the pack when looking at the list of currencies. South Africans should be happy the Rand has not been performing like the Brazilian Real of the Turkish Lira as both of these have lost at least double the amount against the US dollar than what the Rand has since the start of the year. While looking at the exchange rate over 1 month or since the start of the year is interesting, it is a very short time period in the life of currencies or markets. So the image below shows the performance of the exchange rates over the last 4 years:
Picture
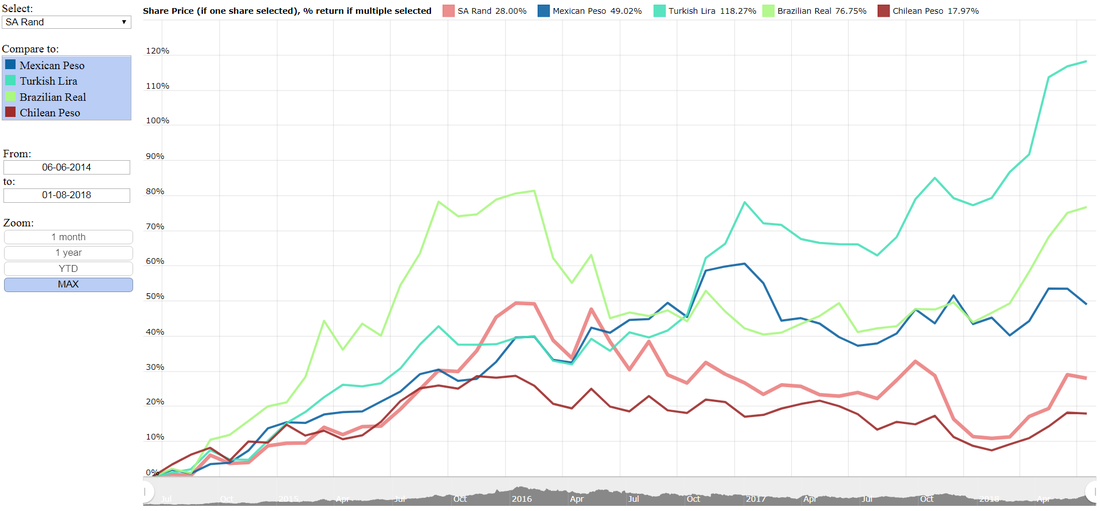
The picture above shows just how bad its been going for the Turkish Lira, even over a longer period such as 4 years. Over the last 4 years the Turkish Lira lost 118% of its value. While 4 years ago it cost 2.1 Turkish Lira for a US dollar. Its currently going at 4.6 Turkish Lira per US dollar. For South Africans, the story is bad, but not Turkish Lira bad. The South African Rand lost 28% of its value against the US dollar over the last 4 years. Four years ago a US dollar cost R10.68, today it costs R13.61 a US dollar.  A summary of all the currencies over the course of 4 years are shown below:
  • Mexican Peso: 49%
  • Chilean Peso: 17.9%
  • South African Rand: 28%
  • Brazilian Real: 76.8%
  • Turkish Lira: 118.3%

As a final note in this article,  it is interesting to see how similar the performance of the Chilean Peso and South African Rand are.  In coming days we will discuss why Chile and South Africa are so similar, not just in terms of currency behaviour but actual economies.

Additional content

Related Topics

  • SA vs World
  • SA's trade data page​


​Homepage

Economics Page
Stock in Focus Page


​About


Contact Us

Copyright © 2015
  • Home
  • Blog
    • Blog-5Jun2018
    • Blog-18May2018
    • Blog-16May2018
    • Blog-3May2018
    • Blog-2May2018
    • Blog-30Apr2018
    • Blog-26Apr2018
    • Blog-24Apr2018
    • Blog-18Apr2018
    • Blog-17Apr2018
    • Blog-16Apr2018
    • Blog-3Apr2018
    • Blog-22Mar2018
    • Blog-20Mar2018
    • Blog-19Mar2018
    • Blog-23Oct2017
    • Blog-20Oct2017
    • Blog-11Oct2017
    • Blog-10Oct2017
    • Blog-6Oct2017
    • Blog-3Oct2017
    • Blog-2Oct2017
  • Economics
    • Rand Dollar Exchange Rate
    • South Africa's GDP
    • South Africa's Unemployment
    • SA by numbers
    • Economic Progress Index
    • Taylors Rule
    • South Africa's Formal Business Sector
    • South-Africa's-Fiscal-Policy
    • SA EU Trade Data
    • Inflation Heat Map
    • Population Density Map
    • Labour Market Dynamics
    • Estimating the Size of the Informal Economy
    • SA Consumer Spending Patterns
    • South Africa's Monetary Fiscal Policy Mix
    • GDP Animations >
      • SouthAfrica
      • WesternCape
      • EasternCape
      • NorthernCape
      • FreeState
      • KwaZuluNatal
      • NorthWest
      • Gauteng
      • Mpumalanga
      • Limpopo
    • South Africa's Economic Structure
    • South Africa's Economic History
    • South Africa's Trade Data Page
    • South Africa's Food and Beverages Sector
    • Financial Well-being of South African Companies_2015
    • SA vs the World
    • Budget Day Page (24 Feb 2016)
  • Stock in Focus
    • JSE ALSI Chart
    • Sector Comparison Page
    • JSE-Calendar-Tracker-2019
    • Adcorp (ADR)
    • Amazon (AMZN)
    • Apple (AAPL)
    • Ascendis (ASC)
    • AVI (AVI)
    • Bidvest (BVT)
    • Blue Label Telecoms (BLU)
    • Bowler Metcalf (BCF)
    • Capitec (CPI)
    • City Lodge Hotel Group
    • Clicks Group (CLS)
    • Coronation (CML)
    • Curro Holdings (COH)
    • Discovery (DSY)
    • Distell (DST)
    • EOH (EOH)
    • Famous Brands (FBR)
    • Ferrari (RACE)
    • FirstRand Group (FSR)
    • Grindrod (GND)
    • GrowthPoint (GRT)
    • Holdsport (HSP)
    • Harley-Davidson (HOG)
    • Hyprop (HYP)
    • Hyprop (HYP)_1Jun2016
    • Investec Property Fund (IPF)
    • JSE (JSE)
    • Massmart (MSM)
    • MediClinic (MEI)
    • MTN (MTN)
    • MTN (MTN)_May2016
    • Mr Price Group (MRP)
    • Mr Price Group (MRP)_8APR2016
    • Nedbank (NED)
    • OneLogix (OLG)
    • Peregrine Holdings (PGR)
    • Pick 'n Pay Stores (PIK)
    • Pioneer Foods (PFG)
    • PSG Group (PSG)
    • Quantum Foods (QFH)
    • RCL Foods (RCL)
    • Remgro (REM)
    • Richemont (CFR)
    • RMB Holdings (RMH)
    • Rolfes (RLF)
    • Sanlam (SLM)
    • Sasol (SOL)
    • Sasol (SOL)_18sep2016
    • Santova (SNV)
    • Spar Group (SPP)
    • Shoprite Holdings (SHP)
    • Spur Corporation (SUR)_7Sep2017
    • Standard Bank (SBK)
    • Steinhoff International Holdings (SNH)
    • Stor-Age (SSS)
    • Super Group (SPG)
    • Taste Holdings (TAS)_30May2016
    • The Foshini Group (TFG)
    • Value Logistics (VLE)
    • Vodacom (VOD)
    • Wilson Bayly Holmes Ovcon (WBO)
    • Woolworths (WHL)
    • Woolworths (WHL)_24Aug2017
    • Zeder (ZED)
  • Online Calculators
    • Rand Petrol Price Estimator
    • Share Valuation
    • Financial Ratios Calculator
    • GDP Growth Estimator
    • Future Value of Investment Calculator
    • Loan repayment calculator
  • Contact
  • About
  • Search