|
|
Related Topics |
The latest update on Pioneer Foods can be found by clicking here
About Pioneer Foods
Pioneer Foods is one of the largest South African producers and distributors of a range of branded food and beverage products. The Group operates mainly across South Africa, providing wholesale, retail and informal trade customers with products of a consistently high standard. Pioneer Foods exports to more than 60 countries across the globe. The growing international business represents 21% of operating profit.
The Group operates a number of world-class production facilities producing a range of products that includes some of the most recognisable and best loved brand names in South Africa, including the following power brands: Weet-Bix, Liqui-Fruit, Ceres, Sasko, Safari, Spekko and White Star.
The equity-accounted, joint venture investments based in South Africa, Nigeria, Botswana and Namibia do not form part of PFI’s segmental results, but are managed by the International division.
These include:
Pioneer Foods was established in 1997 and listed on the Johannesburg Stock Exchange (“JSE”) in 2008. It has three main divisions:
The Group operates a number of world-class production facilities producing a range of products that includes some of the most recognisable and best loved brand names in South Africa, including the following power brands: Weet-Bix, Liqui-Fruit, Ceres, Sasko, Safari, Spekko and White Star.
The equity-accounted, joint venture investments based in South Africa, Nigeria, Botswana and Namibia do not form part of PFI’s segmental results, but are managed by the International division.
These include:
- Alpen Food Company SA (50%)
- Bokomo Botswana (50%)
- Bokomo Namibia (50%)
- Bowman Ingredients South Africa (50%)
- Future Life Health Products (50%)
- Weetabix East Africa (49.89%)
Pioneer Foods was established in 1997 and listed on the Johannesburg Stock Exchange (“JSE”) in 2008. It has three main divisions:
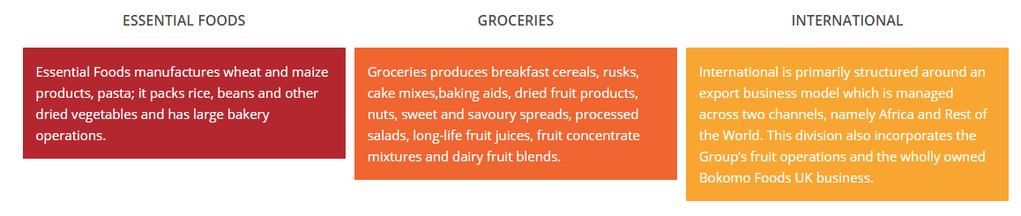
Pioneer Foods Group main divisions
Financial results
The following was published on the JSE Security Exchange News Syteme (SENS) system earlier today
- Revenue (+3% ) to R20 152 million
- Adjusted operating profit (before items of a capital nature)* (+26%) to R1 603 million
- Earnings (+48%) to R1 073 million
- Earnings per share (+47%) to 575 cents
- Diluted earnings per share (+49%) to 547 cents
- Headline earnings ("HE") (+33%) to R1 017 million
- Headline earnings per share (+33%) to 545 cents
- Diluted headline earnings per share (+35%) to 518 cents
- Adjusted headline earnings* (+25%) to R1 032 million
- Adjusted headline earnings per share* (+25%) to 553 cents (which places the group on a price to earnings ratio of 13.9)
- Net cash profit from operating activities (+25%) to R2 073 million
- Net asset value per share (+5%) to 4 497 cents
- Final gross dividend per listed ordinary share: 260 cents
- Total gross dividend per listed ordinary share: 365 cents (which places the group on a dividend yield of 4.7%)
So revenue growth has been pretty flat, their Net asset value per share increased by 5% from the prior year, and headline earnings came in 25% stronger than the previous period. Cash generated per share from their operations amounted to R8.54 a share. Cash and equivalents on the balance sheet amounted to R1.128 billion (or R4.84) per share.
Management commentary on the financial results
Pioneer Foods delivered positive volume and revenue growth at supportive price points whilst maintaining cost discipline and efficiency gains to improve margin and earnings delivery over the weak corresponding period. Trading conditions reflecting weaker levels of consumer spend, became more challenging in the second semester with rising input costs exacerbated by the weakening ZAR and steady oil price increases together with weak demand. This required corrective price adjustment on a phased basis across categories which is expected to continue in the next reporting period.
PROSPECTS
There is a high probability of inflationary pressure driven by continuing rand weakness and increased international oil prices. We thus anticipate muted consumption growth to be a short to medium term reality. In this environment, management will focus in particular on:
- Operating cost growth mitigation;
- Continued improvement in operational efficiencies;
- Improved representation and growth in alternative routes-to-market;
- Sustaining brand relevance; and
- Prudent capital investment in the existing business.
The wheaten value chain, led by bakeries, is expected to sustain the positive volume traction achieved towards the end of the year under review through refined route- to-market capability, enhanced production efficiencies and improved product quality. Although demand for maize meal products should remain strong, given ample local raw material supply and relative consumer value, down-trading within the category is expected to continue. The exceptional maize profit contribution reported in the first half of the 2018 financial year is not expected to be repeated in the next financial year. The Groceries and International divisions should be able to deliver an improved performance with the turnaround at Heinz Foods SA, the anticipated higher vine fruit crop and expectations of a more beneficial ZAR exchange rate for exports. Joint ventures' performance improved materially in the fourth quarter of the 2018 financial year, partly because of the incorporation of the Heinz Foods SA business into Groceries and the improved performance of Bokomo Botswana after the major upgrade of the facility. This is expected to continue into 2019.
Pioneer Foods Group (PFG) share valuation
So the question is should you buy shares in a company who has lost almost half its share price value since the start of the 2018? Does this represent a great buying opportunity or is there a reason why the market has been punishing the group's share price so hard? From what we can see profits per share, cash generation and dividends paid by the group all seem very strong. The group has a strong balance sheet with assets being far greater than that of their liabilities, with roughly R8.5 billion in equity in the group. (Equity in the group amounts to around R36 a share). With their net asset value (NAV) being around R45 a share. So the group's share price is trading at about 1.7 times its net asset value. With their strong brands such as Heinz foods SA, Ceres, Weet-bix, Liquifruit, SASKO, Bokomo etc we dont think the company trading at double its net asset value will be excessive. This will put a rough valuation on the group at around R90 a share.
Based on their current financial results, their prospects, their strong brands and strong balance sheet position, our valuation model places a value of R104.90 per share. We therefore believe at its current price PFG offers excellent long term value for those investors willing to buy and hold and reap the benefits later.