|
Related Topics |
|
We take a look at the latest Pepkor Holdings Limited (formerly Steinhoff Retail Africa) trading update for the 9 months ended June 2019. So how has the group performed in this difficult trading environment for retailers?
|
|
About Pepkor (PPH)
Pepkor began life over 100 years ago and quickly built a reputation of giving South Africans the right products, at the right price, and at their convenience. The group has steadily expanded its footprint over the years to include significant reach into southern Africa, as well as a limited range of other African economies.
The majority of Pepkor’s retail brands operate in the discount and value market segment, which enjoys natural resilience thanks to customers’ ability to buy ‘up’ or ‘down’ according to their budgets, and prevailing economic conditions. Pepkor’s long success rests on its understanding of, and strong relationships with, its customers. Deep, market-specific knowledge is the foundation of the group’s strategic and operational ability and has allowed Pepkor brands to offer southern African customers access to an extensive range of value-for-money products for over a century.
Pepkor is the largest non-grocery retailer in South Africa. With more than 5 300 stores operating across 12 African countries, our businesses include many of the most trusted brands on the continent.
OUR BUSINESS MODEL
An integral part of the Pepkor business model is to ensure that we enhance and add value to both our customers’ and our employees’ lives. This includes our corporate social responsibility initiatives, which form an essential part of our business. Our four strategic pillars are interlocked and collectively focus on empowering people by meeting our customers’ needs for value-for-money products at the best possible prices, and at their convenience.
A few of Pepkor's brands include:
- PEP
- Ackermans
- Tekkie Town
- Bradlows
- Rochester
- Incredible Connection
- BUCO
- Timercity
- Tiletoria
- Capfin
Trading statement
VOLUNTARY TRADING UPDATE FOR THE NINE MONTHS ENDED 30 JUNE 2019
Pepkor increased revenue by 8.5% to R53.1 billion for the nine months ended 30 June 2019. Performance was supported by a stronger third quarter which saw revenue grow by 11.7%, largely benefitting from the shift of Easter to April. Trading however, remains volatile in an environment of continued pressure on consumer spending.
Clothing & general merchandise
The clothing and general merchandise segment reported revenue growth of 6.4% for the nine- month period, supported by 9.2% growth during the third quarter. For the nine-month period, the Pep and Ackermans brands in aggregate reported sales growth of 6.7% and like-for-like sales growth of 2.9%. Retail space expanded by 4.8% year-on- year. Core clothing, footwear and homeware (CFH) product categories achieved 7.1% sales growth and 3.5% like-for-like growth. This remains encouraging in the current operating environment. Pep and Ackermans in aggregate reported inflation of 4.2% in CFH retail selling prices. Pep Africa reported a decline in sales of 0.7% in rand terms for the nine-period. This includes strong constant currency performance with sales growth of 14.9% and like-for-like growth of 11.4%. Good results were achieved in most countries while macro-economic challenges in Zimbabwe continue to impact performance. The Speciality division reported sales growth of 9.5% with like-for-like growth of 4.2%, in aggregate, for the nine-month period. Satisfactory performance was achieved in the clothing product categories with continued softer performance in footwear.
Furniture, appliances & electronics
Performance in the furniture, appliances and electronics segment was supported by income from the new internally-funded credit book. The segment reported revenue growth of 8.3% for the nine-month period, including 10.9% growth during the third quarter. During the nine-month period merchandise sales increased by 1.9% and like-for-like sales declined by 1.3% as financially constrained consumers continue to prioritise spending on essentials over durable product categories. Profitability of this segment will be impacted in the current financial year by the implementation of IFRS 9 on the new internally-funded credit book.
Building materials
Sales growth of 0.6% was achieved in the building materials segment with like-for-like growth of 1.8% during the nine-month period. Sales contracted by 1.1% during the third quarter as high levels of competition remain within the contracting and building materials market. This continues to place significant pressure on margins. Fintech The segment reported 40.7% revenue growth for the nine-month period, including growth in excess of 50% during the third quarter. The FLASH business continues to achieve significant growth, while Capfin’s performance is further supported by income earned on the new internally-funded credit book. The implementation of IFRS 9 will also impact this segment’s profitability.
Outlook
Pepkor’s defensive market position and strategy of providing customers with value at affordable prices continues to resonate with customers, as demonstrated through continued market share growth. This will continue to support performance in challenging operating conditions where sales volatility is expected to continue as customers have to contend with high levels of unemployment and increased cost of living in what remains to be an extremely challenging retail environment.
Impact of Pepkor group’s pro forma constant currency disclosure
The Pepkor group discloses unaudited constant currency information to indicate Pep Africa’s performance in terms of sales growth, excluding the effect of foreign currency fluctuations. To present this information, current period turnover for Pep Africa reported in currencies other than ZAR are converted from local currency actuals into ZAR at the prior year's actual average exchange rates.
The table below sets out the percentage change in sales, based on the actual results for the period, in reported currency and constant currency for the basket of currencies in which Pep Africa operates.
% change in sales on prior period Reported currency Constant currency
Pep Africa (0.7%) 14.9%
The information included above is the responsibility of the directors and does not constitute an earnings forecast and has not been reviewed and reported on by the Company’s external auditors. The constant currency information has been prepared for illustrative purposes only.
Share price performance
The screenshot below taken from Sharenet shows the share price performance of Pepkor (PPH) over the last year. Below a summary of the performance of Pepkor shares over various time periods:
- 1 week: -1.23%
- 1 month: -6.32%
- Year to date (YTD): -19.44%
- 1 Year: 2.42%
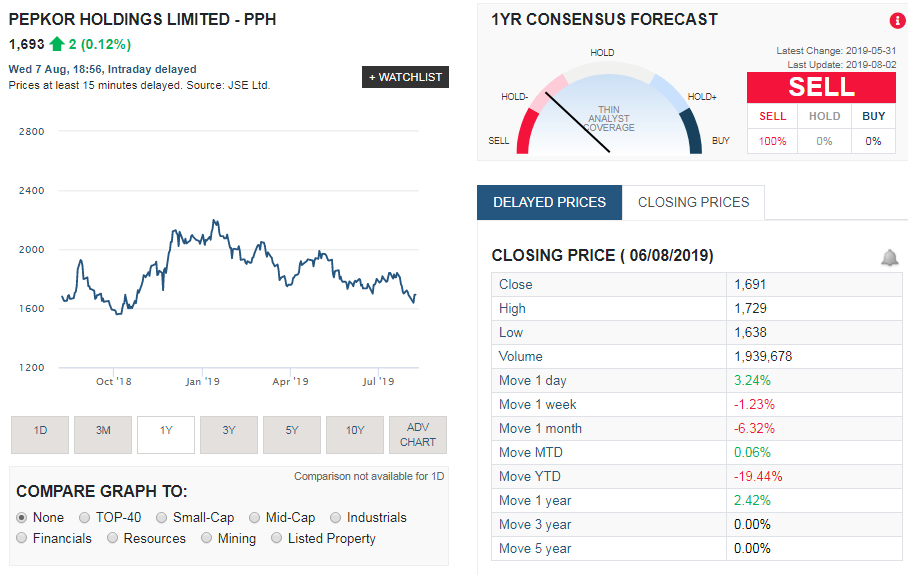
The trading update provided to the markets today is a lot better than what most retailers are bringing to the market so it looks like Pepkor is perfectly placed to weather the difficult economic times currently being experienced in South Africa and other African economies.