|
Related Topics |
|
We take a look at the latest financial results from listed Telecoms operator MTN for the year ending December 2018. After the release of the trading statement the shares were punished as the market was expecting better. However based on early trade after the results release, it looks like the market is pretty happy with MTN now. Up 10% for the day as at the time of writing
|
|
About MTN
For those who dont know anything about MTN. Below a brief description of what the group is about.
MTN is a leading emerging market mobile operator, serving 233 million subscribers in 21 countries across Africa and the Middle East. MTN Group Ltd. is a pure-play emerging markets mobile telco operator at the forefront of technological and digital changes. The Group offers voice, data and digital services to retail customers in the 21 countries in which its operations have telecoms licences.
MTN is a leading emerging market mobile operator, serving 233 million subscribers in 21 countries across Africa and the Middle East. MTN Group Ltd. is a pure-play emerging markets mobile telco operator at the forefront of technological and digital changes. The Group offers voice, data and digital services to retail customers in the 21 countries in which its operations have telecoms licences.
Read the latest MTN results update as at 8 August 2019 here
Financial Results Overview
Firstly we take a look at the financial highlights as stated by MTN's management
- Service revenue up 10,7%
- EBITDA margin up 1,7 percentage points to 35,9%
- EBITDA (before once-off items) up 15,9*
- Group HEPS up 85,2% to 337 cents per share
- Group HEPS (after adjustments) 565 cents per share
- Holding Company leverage improves to 2,3x
- Capex intensity 19,3%
- Final dividend of 325 cents per share
- Growth accelerating, medium-term targets raised and expanded
Now for the numbers we are interested in:
- Revenue: R134.6 billion (up 1.3% from R132.6 billion in the prior)
- Profit for the period: R8.7 billion (up 197% from R4.4 billion in the prior year)
- Net profit margin: 6.46%
- Diluted Headline Earnings per share: R3.32 (up 85% from R1.79 in the prior year)
- PE ratio: 25 (when using the more realistic headline earnings per share number)
- Dividend declared for period: R5 per share
- Dividend yield: 6%
- Cash generated from operations: R33.2 billion (down -2.9% from R33.38 billion in the prior year)
- Cash generated from operations per share: R17.65 per share
- Net asset value per share: R49.89 (up 1.1% from R49.30 in the prior year)
- So trading at about 1.66 times its stated net asset value
- Cash on balance sheet: R14.97 billion (down 6.1% from R15.94 billion in the prior year)
- Cash on balance sheet per share: R7.96 or 9.5% of the current share price
Management commentary on the results
Group president and CEO, Rob Shuter comments:
"MTN delivered a very encouraging performance in 2018, meeting our targets for growth in service revenue and EBITDA, as well as those on reducing capex intensity and improving holdco leverage. The group has now delivered eight quarters of continued operational improvements. We continue to benefit from the demographic dividend in the countries in which we operate and, while the markets remain challenging, we continue to target service revenue growth ahead of inflation. In the year we made good progress in resolving key regulatory challenges in markets including Benin, Cameroon and Nigeria. Managing regulatory issues and improving relationships and risk management remains key focus areas for the group, and we will continue to strengthen these areas in 2019. Over the next few years, we see significant opportunity to grow subscribers and voice revenue as we also execute on the large mobile data opportunity. We will also extend our BRIGHT strategy to build MTN into a digital operator with a major focus on the fintech, digital, enterprise and wholesale business areas. We believe everyone deserves the benefits of a modern connected life and see opportunity for MTN in providing this. We are confident that MTN is well placed to continue to deliver on our medium-term guidance and the board remains committed to targeting growth of 10% to 20% in the dividend going forward."
Overview
MTN reported improved constant currency results for the year ended 31 December 2018, delivering ahead of our medium-term targets as we remained focused on executing our BRIGHT strategy. Growth in service revenue accelerated, the margin on earnings before interest, taxation, depreciation and amortisation (EBITDA) increased, and voice and data revenues continued to expand. Macroeconomic conditions were challenging in the second half of the year, particularly in the Middle East. In Iran, the re-introduction of US sanctions resulted in material currency depreciation and increased inflationary pressures and no further cash was repatriated in the second half. At 31 December 2018, group receivables of R2,8bn remained in Iran.
Prospects and guidance
MTN is a leading operator in regions with the fastest growing telecoms markets. Guided by our BRIGHT strategy, we are well positioned to grow by leveraging our scale and enhancing our competitive position. With our expanding population coverage and drive to accelerate smartphone adoption, we will take advantage of the material data and digital opportunity in our markets. In addition, the combination of our large customer base, extensive networks and deep distribution will allow us to drive opportunities in fintech, digital, wholesale and enterprise delivering value for all stakeholders.
Revised medium-term guidance
We have revised our medium-term (three to five years) guidance on service revenue growth from upper-single-digit in constant currency terms to double digit growth, driven by double-digit growth from MTN Nigeria and mid-single-digit growth from MTN South Africa. Over this period, we expect to continue to widen our group EBITDA margin. By leveraging historical investments, improved procurement processes and an increasing revenue contribution from our digital businesses, we expect the group capex intensity to steadily improve over the medium-term following the introduction of IFRS 16 effective from 2019. Our improving revenue growth, margins and capex intensity are anticipated to drive significant improvements in group returns. We expect our adjusted ROE to improve from 11,5% in 2018, to above 20% over the medium term. While the board remains committed to targeting growth of 10% to 20% in the dividend going forward, for 2019 this is likely to be towards the lower end of this range.
Share Price Performance
The screenshot below, taken from Sharenet shows the share price performance of MTN over the last 3 years. It also shows the stock's performance over various time frames as well as the sharp increase in the share price today following the release of the financial results
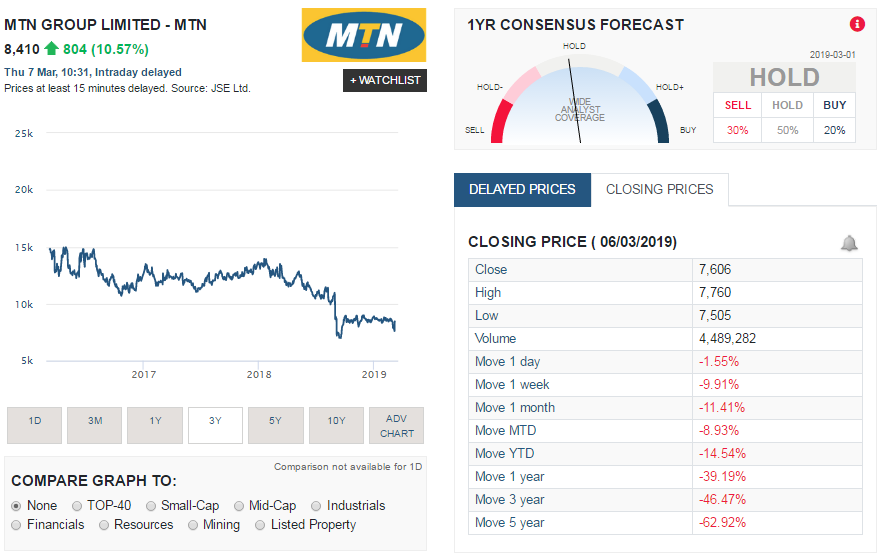
The summary below shows the performance of MTN's share price over various time periods:
So its clear MTN shares have not been performing very well and has left investors pretty bruised and battered. And based on the trading statement released we expect MTN's share price to continue struggling for a long while still.
- 1 week:- 9.91%
- 1 month: -11.41%
- Year to date (YTD): -14.54%
- 1 year: -39.19%
- 3 year: -46.47%
- 5 year: -62.92%
So its clear MTN shares have not been performing very well and has left investors pretty bruised and battered. And based on the trading statement released we expect MTN's share price to continue struggling for a long while still.
MTN Shares valuation
So what are MTN shares worth. Well their balance sheet is strong, they have a decent net profit margin, a strong balance sheet and made decent profits in the last year. They do however continue to have regular clashes with the Nigerian authoroties regarding penalties they need to pay and cash being repatriated out of the country, In addition to this they have a big market in Iran, from which they struggle to repatriate cash too since sanctions are often imposed on the country.
But with this all being said, their tougher markets are the more lucarative and their biggest markets so should there be no issues in these markets over the next couple of years MTN could see bumper profits coming from these countries which should be good for its share price. Based on current financials and future prospects our valuation model places a target price of R94.52 on MTN. So if they trade in the low R70's again anytime soon we would recommend buying a few. Aim to buy at least 10% to 15% below our target price to get the most upside out of the share.
But with this all being said, their tougher markets are the more lucarative and their biggest markets so should there be no issues in these markets over the next couple of years MTN could see bumper profits coming from these countries which should be good for its share price. Based on current financials and future prospects our valuation model places a target price of R94.52 on MTN. So if they trade in the low R70's again anytime soon we would recommend buying a few. Aim to buy at least 10% to 15% below our target price to get the most upside out of the share.