|
Related Topics |
|
We take a look at the trading statement of Mpact for the 6 months ending June 2020. This release includes the impact of Covid-19 in which the group reported a -9% decline in sales for April and May 2020 compared to the prior year
|

|
About Mpact
Mpact is the largest paper and plastics packaging and recycling business in Southern Africa. Our integrated business model is uniquely focused on closing the loop in plastic and paper packaging through recycling and beneficiation of recyclables. Innovation lies at the heart of our strategy and we use our close relationships with customers and our understanding of their industries to anticipate their needs and create structural and graphic solutions, as well as value added services.
In 2019, we had 5,142 employees working at 41 operating sites in South Africa, Namibia and Mozambique, and generating revenue of R11.1 billion. Our footprint, leading market positions and proximity to customers contribute to faster response times, reduce transport costs and create economies of scale.
Mpact is South Africa’s largest collector of recyclable packaging. We collected over 624,000 tonnes of paper and plastic recyclables from pre-and post-consumer sources. By closing the loop on paper and plastic, we reduce the amount of material going to landfill, promote local beneficiation of raw materials and support the development of more than 50 small businesses.
Our liquid packaging recycling plant can recycle 24,000 tonnes of used liquid cartons a year, saving 65,240m3 of landfill space and approximately 11,400 tonnes of carbon emissions

Mpact trading statement for the 6 months ending June 2020
COVID-19 IMPACT
For the duration of the nationwide lockdown imposed from 27 March 2020, in response to the COVID-19 pandemic, all divisions within Mpact were designated as essential service providers due to Mpact being one of the critical supply chain links in the South African economy, producing paper and packaging for food, pharmaceuticals and other essential products. As such, most of Mpact’s facilities have remained operational since the start of the lockdown. Mpact’s first priority is to provide and maintain a safe and healthy work environment for all of its employees. To this end, a comprehensive plan of action with stringent safety and hygiene practices to mitigate the risks associated with the pandemic has been implemented across all operations in addition to the strict pre-existing health and safety measures. Not all the packaging manufactured by Mpact is used for purposes of packaging essential goods.
Consequently, non-essential production lines, such as those producing packaging for quick-service restaurants and alcoholic beverages, did not operate throughout the lockdown period. Additionally, the nationwide lockdown has had a negative impact on demand for other paper and plastics packaging products. As a result, total sales revenue from continuing operations for the months of April and May 2020 declined by approximately 9% when compared to the same prior year period and total revenue for the five months ended 31 May 2020 decreased by 3.2%. Mpact has implemented numerous measures to reduce costs and conserve cash. Cash reserves are closely managed through, inter alia, monitoring available banking facilities, debtors’ payments, inventory levels and postponing non-essential capital expenditure. Other cost initiatives include negotiating reduced rentals, employees agreeing to salary reductions, reviewing non-essential contracts and temporarily closing production lines, where necessary. The Group’s debt facility headroom as at 31 May 2020 was approximately R700 million and the Group is expected to meet its debt facility covenants. TRADING STATEMENT In terms of the Listings Requirements of the JSE Limited, companies are required to publish a trading statement as soon as they are satisfied that a reasonable degree of certainty exists that the financial results for the period to be reported on next will differ by 20% or more from the financial results of the previous corresponding reporting period.
Shareholders are advised that for the six months ending 30 June 2020, Mpact expects underlying earnings before interest and taxation ("Underlying EBIT") from continuing operations to be at least 50% lower than the Underlying EBIT for the six months ended 30 June 2019 of R255 million. Net finance costs for the period are expected to be at least 20% lower than the comparable prior period due to lower interest rates and lower average net debt. Mpact’s basic earnings per share ("EPS"), headline earnings per share ("HEPS") and underlying earnings per shares ("Underlying EPS") from continuing and total operations for the period are expected to be at least 80% lower than the those reported for the corresponding six-month period ended 30 June 2019, or at least 45.3 cents per share ("cps") lower in continuing operations and at least 31.2 cps lower in total operations.
The reported EPS, HEPS and Underlying EPS for the corresponding six-month period ended 30 June 2019 are set out below. Actual Six months ended 30 June 2019 :
Continuing Operations (cps) Total Operations Operations (cps)
The impact of the ongoing lockdown on the Group’s financial performance remains uncertain. The Company is therefore not in a position at this stage to provide more specific guidance on the expected earnings for the interim reporting period ending 30 June 2020. A further trading statement will be released as soon as the Group has a reasonable degree of certainty on the expected HEPS and EPS ranges for the current six-month period ending 30 June 2020. Shareholders are advised that the financial information on which this trading statement is based has not been reviewed and reported on by the Company’s external auditor.
For the duration of the nationwide lockdown imposed from 27 March 2020, in response to the COVID-19 pandemic, all divisions within Mpact were designated as essential service providers due to Mpact being one of the critical supply chain links in the South African economy, producing paper and packaging for food, pharmaceuticals and other essential products. As such, most of Mpact’s facilities have remained operational since the start of the lockdown. Mpact’s first priority is to provide and maintain a safe and healthy work environment for all of its employees. To this end, a comprehensive plan of action with stringent safety and hygiene practices to mitigate the risks associated with the pandemic has been implemented across all operations in addition to the strict pre-existing health and safety measures. Not all the packaging manufactured by Mpact is used for purposes of packaging essential goods.
Consequently, non-essential production lines, such as those producing packaging for quick-service restaurants and alcoholic beverages, did not operate throughout the lockdown period. Additionally, the nationwide lockdown has had a negative impact on demand for other paper and plastics packaging products. As a result, total sales revenue from continuing operations for the months of April and May 2020 declined by approximately 9% when compared to the same prior year period and total revenue for the five months ended 31 May 2020 decreased by 3.2%. Mpact has implemented numerous measures to reduce costs and conserve cash. Cash reserves are closely managed through, inter alia, monitoring available banking facilities, debtors’ payments, inventory levels and postponing non-essential capital expenditure. Other cost initiatives include negotiating reduced rentals, employees agreeing to salary reductions, reviewing non-essential contracts and temporarily closing production lines, where necessary. The Group’s debt facility headroom as at 31 May 2020 was approximately R700 million and the Group is expected to meet its debt facility covenants. TRADING STATEMENT In terms of the Listings Requirements of the JSE Limited, companies are required to publish a trading statement as soon as they are satisfied that a reasonable degree of certainty exists that the financial results for the period to be reported on next will differ by 20% or more from the financial results of the previous corresponding reporting period.
Shareholders are advised that for the six months ending 30 June 2020, Mpact expects underlying earnings before interest and taxation ("Underlying EBIT") from continuing operations to be at least 50% lower than the Underlying EBIT for the six months ended 30 June 2019 of R255 million. Net finance costs for the period are expected to be at least 20% lower than the comparable prior period due to lower interest rates and lower average net debt. Mpact’s basic earnings per share ("EPS"), headline earnings per share ("HEPS") and underlying earnings per shares ("Underlying EPS") from continuing and total operations for the period are expected to be at least 80% lower than the those reported for the corresponding six-month period ended 30 June 2019, or at least 45.3 cents per share ("cps") lower in continuing operations and at least 31.2 cps lower in total operations.
The reported EPS, HEPS and Underlying EPS for the corresponding six-month period ended 30 June 2019 are set out below. Actual Six months ended 30 June 2019 :
Continuing Operations (cps) Total Operations Operations (cps)
- EPS: 57.8 40.2
- HEPS: 56.6 39.0
- Underlying EPS: 57.0 39.4
The impact of the ongoing lockdown on the Group’s financial performance remains uncertain. The Company is therefore not in a position at this stage to provide more specific guidance on the expected earnings for the interim reporting period ending 30 June 2020. A further trading statement will be released as soon as the Group has a reasonable degree of certainty on the expected HEPS and EPS ranges for the current six-month period ending 30 June 2020. Shareholders are advised that the financial information on which this trading statement is based has not been reviewed and reported on by the Company’s external auditor.
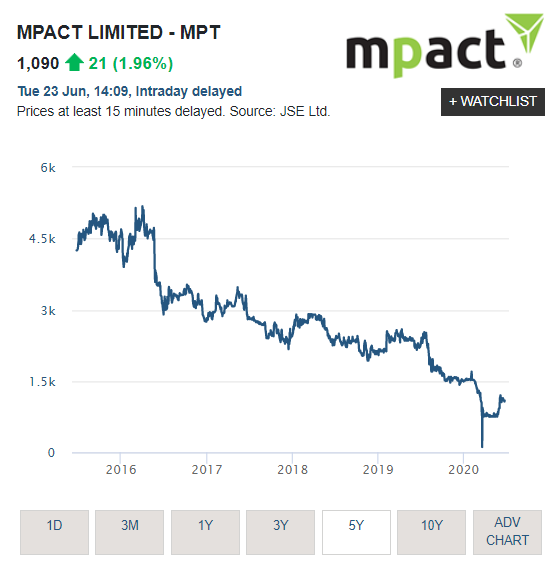
Mpact Share price history over the last 5 years
The image below shows the share price history of Mpact over the last 5 years. And its not been a good time for Mpact shareholders, with the stock declining significantly over the last 5 years.