|
Related Topics |
|
We take a look at the interim results for the period ending end of August 2018 of Mix telematics, following hot in the heels of their competitor in the fleet management and vehicle tracking space, Cartrack
|
|
About Mix telematics
MiX Telematics is a leading global provider of fleet and mobile asset management solutions delivered as SaaS to customers in approximately 120 countries. MiX Telematics Limited (“MiX Telematics” or “MiX”) was founded in 1996 and has offices in South Africa, Uganda, the United Kingdom, the United States, the United Arab Emirates, Australia, Romania, Thailand and Brazil, as well as having a network of more than 130 fleet partners worldwide. MiX actively manages over 676,000 mobile assets in approximately 120 countries and employs 1,054 people. MiX’s solutions rely on our proprietary, highly scalable technology platform, which allows us to collect, analyze and deliver data from our customers’ vehicles and present this on an intuitive, web-based interface. Our fleet customers can access large volumes of historical and real-time data, monitor the location and status of their drivers and vehicles, and view a wide selection of reports and key performance indicator dashboards. MiX Telematics shares are publicly traded on the Johannesburg Stock Exchange (JSE: MIX) and on the New York Stock Exchange (NYSE: MIXT) in the form of American Depositary Shares (“ADSs”).
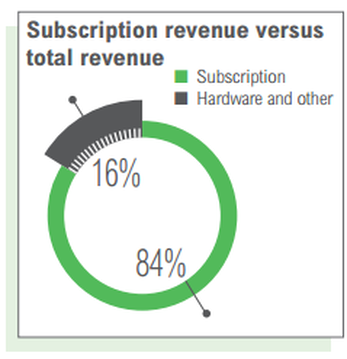
Mix telematics revenue sources
Mix telematics history
Founded in 1996 in South Africa, MiX Telematics is a leading global provider of fleet and mobile asset management solutions delivered as Software-as-a-Service or SaaS. The MiX Telematics range of products and services is sold in over 120 countries worldwide with over 700,000+ subscribers to date – and growing. We have offices in South Africa, the United Kingdom, the United States, Uganda, Brazil, Australia, and the United Arab Emirates.
MiX Telematics employs over 1,000 people who are dedicated to the design, development, sales and support of our solutions and services. With an international heritage dating back to 1985, MiX Telematics continuously invests in research and development and has built a solid reputation for innovative fleet management technology and services for the consumer and commercial vehicle market.
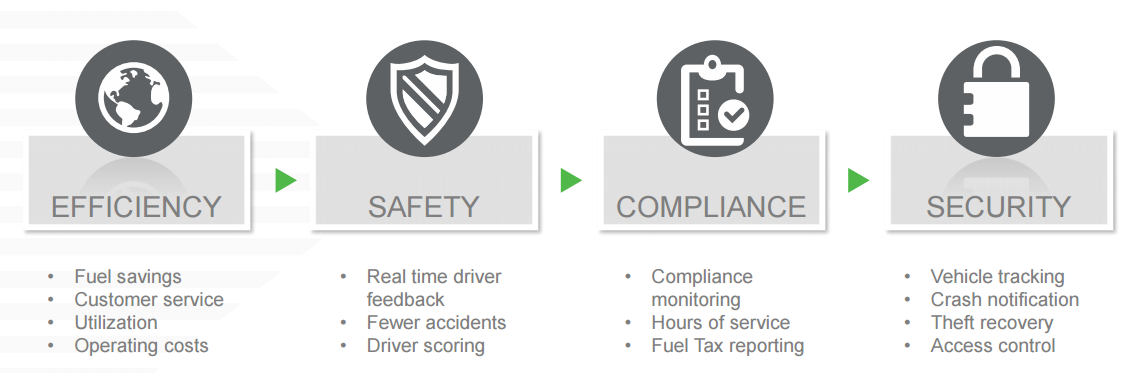
Our solutions provide enterprise fleets, small fleets and consumers with solutions for safety, efficiency, compliance and security.
Our commercial fleet solutions are built on the basis of in-vehicle hardware, on-demand software services, as well as accessories and applications that enhance overall performance. Through the web-based software platform, fleet customers can access their fleet information and generate key reports.
Our consumer offering comprises of stolen vehicle recovery products and services sold under the Matrix and Beame product brands in South Africa. Value-added personal services such as Crash Alert, Road-Side Assistance, Internet Tracking and GPS Logbook are a few of the differentiators in this range.
As a leading vehicle monitoring business in South Africa specialising in fleet management with a Level 2 Contributor BBBEE rating, the provision of enterprise fleet solutions allows us to build personal relationships with our customers to ensure a positive return on investment. Our strength lies in the growth and retention of our customer relationships through the sharing of knowledge and implementation of technology. MiX Telematics's purpose-designed mobile applications for consumers and fleet managers allow customers on the move to keep track of their vehicles, drivers and other mobile assets at all times.
MiX Telematics employs over 1,000 people who are dedicated to the design, development, sales and support of our solutions and services. With an international heritage dating back to 1985, MiX Telematics continuously invests in research and development and has built a solid reputation for innovative fleet management technology and services for the consumer and commercial vehicle market.
Our solutions provide enterprise fleets, small fleets and consumers with solutions for safety, efficiency, compliance and security.
Our commercial fleet solutions are built on the basis of in-vehicle hardware, on-demand software services, as well as accessories and applications that enhance overall performance. Through the web-based software platform, fleet customers can access their fleet information and generate key reports.
Our consumer offering comprises of stolen vehicle recovery products and services sold under the Matrix and Beame product brands in South Africa. Value-added personal services such as Crash Alert, Road-Side Assistance, Internet Tracking and GPS Logbook are a few of the differentiators in this range.
As a leading vehicle monitoring business in South Africa specialising in fleet management with a Level 2 Contributor BBBEE rating, the provision of enterprise fleet solutions allows us to build personal relationships with our customers to ensure a positive return on investment. Our strength lies in the growth and retention of our customer relationships through the sharing of knowledge and implementation of technology. MiX Telematics's purpose-designed mobile applications for consumers and fleet managers allow customers on the move to keep track of their vehicles, drivers and other mobile assets at all times.
Overview of product offerings from Mix telemetics
So what type of services does Mix telemetics offer their customers?
- Their product offerings include:
- Real time driver feed back
- Driver scoring
- Measuring hours of service
- Vehicle tracking
- Crash notification
- Theft recovery
- Access control
So get to the numbers already
So lets take a look at the main numbers published in the results update:
- Subscription revenue of R420 million ($29.7 million), an increase of 18.5% year over year, on a constant currency basis
- Net subscriber additions of over 22,000, bringing the total base to over 714,000 subscribers, up 12% year over year
- Operating profit of R87 million ($6.1 million), up 92% year over year
- Adjusted EBITDA of R153 million ($10.8 million), up 48% year over year
- Adjusted EBITDA margin of 30.8%, up 570 basis points year over year
- Free cash flow of R93 million ($6.6 million), up from R4 million ($0.3 million) compared to the second quarter of fiscal 2018
- Quarterly dividend of 3c a share (placing them on a dividend yield of 1.26%
- Diluted earnings per share of 12c (placing them on a massive PE ratio of 39 (assuming the earnings per share of the first 6 months are to be repeated in the next 6 months)
- Cash generated from operations came in at R221,19 million or 38c a share
So any comments from management on the results?
Below follows a few extracts from Mix's financial results.
MiX reported a very strong second quarter, highlighted by our ability to exceed expectations across all key operating metrics," said Stefan Joselowitz, Chief Executive Officer of MiX Telematics. "Our over 18% year over year subscription revenue growth was broad-based, driven by uptake from our premium fleet customers globally. Additionally, this is the ninth consecutive quarter of year over year adjusted EBITDA margin improvement, reaching over 30%. MiX remains well positioned to maintain the momentum for the second half of fiscal 2019 and beyond given the strong and growing pipeline of opportunities worldwide.
MiX reported a very strong second quarter, highlighted by our ability to exceed expectations across all key operating metrics," said Stefan Joselowitz, Chief Executive Officer of MiX Telematics. "Our over 18% year over year subscription revenue growth was broad-based, driven by uptake from our premium fleet customers globally. Additionally, this is the ninth consecutive quarter of year over year adjusted EBITDA margin improvement, reaching over 30%. MiX remains well positioned to maintain the momentum for the second half of fiscal 2019 and beyond given the strong and growing pipeline of opportunities worldwide.
MiX Telematics has translated U.S. Dollar amounts in this Business Outlook paragraph from South African Rand at the exchange rate of R14.5849 per $1.00, which was the R/$ exchange rate reported by Oanda.com as at October 29, 2018.
Based on information as of today, November 1, 2018, the Company is issuing the following financial guidance for the full 2019 fiscal year:
- Subscription revenue - R1,683 million to R1,695 million ($115.4 million to $116.2 million), which would represent subscription revenue growth of 17.3% to 18.2% compared to fiscal 2018. On a constant currency basis, this would represent subscription revenue growth of 15.3% to 16.2%. Previous guidance was R1,624 million to R1,645 million.
- Total revenue - R1,930 million to R1,963 million ($132.3 million to $134.6 million), which would represent revenue growth of 12.7% to 14.6% compared to fiscal 2018. On a constant currency basis, this would represent revenue growth of 10.9% to 12.8%. Previous guidance was R1,864 million to R1,895 million. - Adjusted EBITDA - R550 million to R570 million ($37.7 million to $39.1 million), which would represent Adjusted EBITDA growth of 24.5% to 29.0% compared to fiscal 2018. Previous guidance was R526 million to R545 million.
- Adjusted earnings per diluted ordinary share of 35.1 to 37.9 South African cents based on 583 million diluted ordinary shares in issue (previous guidance was 31.2 to 33.2 South African cents based on 587 million diluted ordinary shares in issue), and based on an effective tax rate of 28.0% to 31.0%. At a ratio of 25 ordinary shares to one ADS, this equates to adjusted earnings per diluted ADS of 60.2 to 65.0 U.S. cents.
For the third quarter of fiscal 2019, the Company expects subscription revenue to be in the range of R429 million to R434 million ($29.4 million to $29.8 million) which would represent subscription revenue growth of 14.0% to 15.3% compared to the third quarter of fiscal 2018. On a constant currency basis, this would represent subscription revenue growth of 13.3% to 14.6%.
Mix telematics share price history
Below an interactive graphic showing Mix share price history over the last 3 years. And the share price has performed exceptionally well. Perhaps punters like its Rand hedge potential. But we will be very surprised if it holds on to these price levels after the results published today.
Percent change: