|
Related Topics |
|
We take a look at the trading statement released today by Iron Ore Giant, Kumba Iron Ore. It's share price has seen a massive spike in recent months as tailing dams in Brazil collapsed prompting Vale to stop production at their iron ore mines in Brazil. But this misfortune at Vale which is pushing up Iron ore prices will only show in Kumbo's next set of financial results. They are expected to report very strong earnings with the trading statement coming out 5 weeks before the end of the financial period they will report results on
|

|
About Kumba Iron Ore
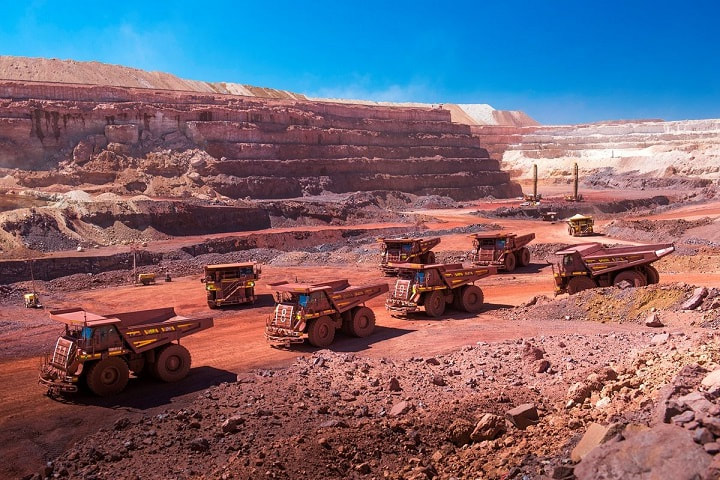
Kumba is a mining group of companies focusing on the exploration, extraction, beneficiation, marketing and sale and shipping of iron ore. Kumba produces iron ore in South Africa at Sishen and Kolomela mines in the Northern Cape province. It is part of the AngloAmerican mining group.
Sishen mine, is near the town of Kathu in the Northern Cape Province. Sishen is our flagship operation and one of the largest open pit mines in the world – some 14km long. Sishen mine has sufficient reserves to sustain a 19-year life of mine. The bulk of our iron ore production comes from Sishen mine, with most of it being exported. We mine by opencast methods and then transport the ore to the beneficiation plant where it is crushed, screened and beneficiated. We beneficiate our products through dense media separation and jig technology. The jig plant at Sishen mine is the largest of its type in the world. At Sishen we produce iron ore products which meet different specifications, according to our customers’ needs.
Kolomela mine, is near Postmasburg in the Northern Cape Province. Kolomela is our newest mining operation, having been completed at the end of 2011. Its name means ‘to dig deeper’ or ‘to persevere’. Kolomela has a life of mine of 25 years. Our team members at Kolomela mine have done an excellent job of ramping up the mine and sustaining its production over the last few years. Our Kolomela lump iron ore is in demand because of its excellent physical strength and high iron content.
Trading Statement
Kumba production and sales report for the fourth quarter, and trading statement, for the year ended 31 December 2019
Production and sales report for the fourth quarter and year ended 31 December 2019
Kumba CEO, Themba Mkhwanazi, said "Kumba delivered a solid operational performance with total production of 42.4Mt and total sales of 42.2 Mt. This in line with the full-year guidance of 42-43Mt and 41.5-42.5Mt, respectively." Production and sales volumes referred to are 100% of Sishen Iron Ore Company Proprietary Limited ("SIOC"), and attributable to shareholders of Kumba as well as the non-controlling interests in SIOC. Overview: - Strong safety and sustainability focus, marking over three and a half years of fatality-free operations.
- Total sales for 2019 of 42.2Mt (2019 guidance: 41.5-42.5Mt) were 2% below 2018 as a result of lower off-take from ArcelorMittal SA due to a decision to wind down operations at its Saldanha Steel plant. Export sales for the year were flat at 40Mt, with an 8% quarter-on-quarter increase in Q4 2019 offsetting lower domestic sales.
- Total production of 42.4Mt for the year (2019 guidance: 42-43 Mt) decreased by 2%, primarily due to the temporary closure of Kolomela's dense media separation (DMS) plant for an infrastructure upgrade. For Q4 2019, production increased by 12% to 11.8Mt, driven by improved performance at Sishen and the restarting of the Kolomela DMS plant as scheduled.
- Total finished stock of 6.4Mt with 2.2Mt at Saldanha Port, ensures that Kumba is well positioned for Q1 2020.the Company has reasonable certainty on the expected HEPS and EPS ranges for the period as required by the Listings Requirements.
Kumba's continuous drive towards new levels of P101 benchmark operational efficiency resulted in Sishen's waste stripping increasing by 11% to 45.3Mt for the quarter (Q4 2018: 50.7Mt), with Kolomela's waste stripping remaining relatively flat at 14Mt. Kumba realised an average FOB iron ore export price of US$97/tonne (2018: US$72/tonne) for the year, on the back of an average lump ratio of 67% and the average Fe quality of 64.2% Fe.
Trading statement for the year ended 31 December 2019
Kumba is currently finalising its financial results for the year ended 31 December 2019 ("the period"), which will be released on the Johannesburg Stock Exchange News Service (“SENS”) on 18 February 2020. In accordance with section 3.4(b) of the JSE Limited Listings Requirements, shareholders are advised that headline earnings for the period are likely to be between R15,680 million and R16,826 million. Headline earnings per share (HEPS) are likely to be between R48.93 and R52.47, an increase of between 62% and 73% from the previous year ended 31 December 2018 ("comparative period").
Reported headline earnings and HEPS for the comparative period (released on SENS on 19 February 2019) were R9,677 million and R30.28, respectively. Basic earnings for the period are expected to be between R15,636 million and R16,776 million. Basic earnings per share (EPS) are expected to be between R48.79 and R52.34, an increase of between 62% and 74%. Reported basic earnings and EPS for the comparative period were R9,615 million and R30.08 respectively. The increase in earnings for the period is largely attributable to the higher average realised FOB export ore price and a weaker Rand/US Dollar exchange rate, relative to the comparative period. Further information will be provided in the company's results for the period to be released on SENS on 18 February 2020.
The financial information on which this trading statement is based, has not been reviewed and reported on by the Company’s external auditors.
Kumba (KIO) share price performance
The screenshot of KIO taken from Sharenet below shows that KIO has rewarded shareholders over the short and medium term, with it providing positive growth so far this month, since the start of the year, over the last year and over the last 3 years, with just the returns over the last 5 years being negative: Below a summary of KIO's share price performance over various time periods:
- Last Week: 3.36%
- Month to Date (MTD) : 0.23%
- Year to Date (YTD): 0.23%
- 1 year move: 49.71%
- 3 year move: 171.42%
- 5 year move: 86.35%
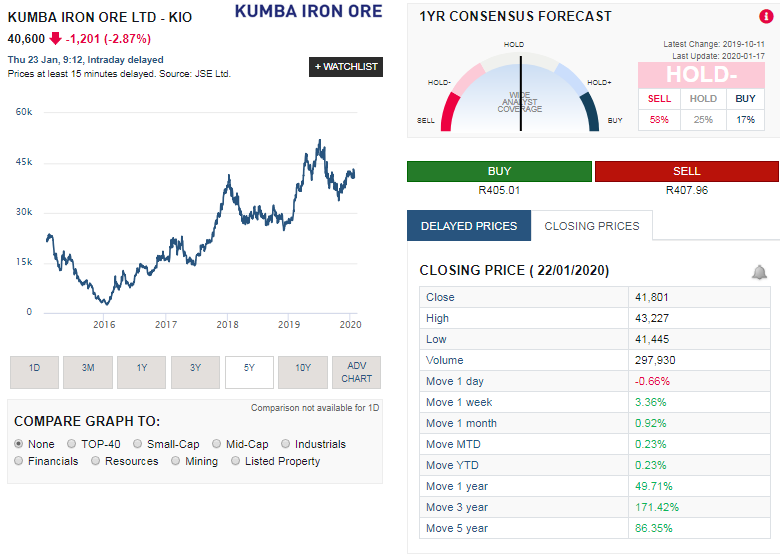
Kumbo Iron Ore Share Price performance in recent months benefited from Vale issues
Kumba (KIO) share valuation (as per our last update on KIO on 19 February 2019)
As we mentioned in the introduction, Kumbo Iron Ore shares surged since the start of the year after a tailing dam in Brazil belonging to Vale broke and the ensuing flooding killed almost 170 people lead to Vale suspending the production of Iron ore at the close by iron ore mines, which sent up iron ore prices on supply fears. But all of this happened in the new year and is not currently reflected in KIO's financial results, but it should have a positive impact on their next set of earnings. Based on this and KIO current financial results which places them on a PE ratio of less than 13 and a dividend yield of almost 8% with strong cash generation capacity and loads of cash on their balance sheet, we value the group at R446.68 a share. So we do believe there is value in the share and if the increase in iron ore prices due to the problems in Brazil for Vale filters through into Kumbo's earnings their next set of results will probably have bumper profits, in which investors can hope for a nice windfall divinde.