|
Related Topics |
|
We take a look at the full year results for the period ending December 2018 from Iron Ore Giant, Kumba Iron Ore. It's share price has seen a massive spike in recent months as tailing dams in Brazil collapsed promting Vale to stop production at their iron ore mines in Brazil. But this misfortune at Vale which is pushing up Iron ore prices will only show in Kumbo's next set of financial results
|

|
About Kumba Iron Ore
Kumba is a mining group of companies focusing on the exploration, extraction, beneficiation, marketing and sale and shipping of iron ore. Kumba produces iron ore in South Africa at Sishen and Kolomela mines in the Northern Cape province. It is part of the AngloAmerican mining group.
Sishen mine, is near the town of Kathu in the Northern Cape Province. Sishen is our flagship operation and one of the largest open pit mines in the world – some 14km long. Sishen mine has sufficient reserves to sustain a 19-year life of mine. The bulk of our iron ore production comes from Sishen mine, with most of it being exported. We mine by opencast methods and then transport the ore to the beneficiation plant where it is crushed, screened and beneficiated. We beneficiate our products through dense media separation and jig technology. The jig plant at Sishen mine is the largest of its type in the world. At Sishen we produce iron ore products which meet different specifications, according to our customers’ needs.
Kolomela mine, is near Postmasburg in the Northern Cape Province. Kolomela is our newest mining operation, having been completed at the end of 2011. Its name means ‘to dig deeper’ or ‘to persevere’. Kolomela has a life of mine of 25 years. Our team members at Kolomela mine have done an excellent job of ramping up the mine and sustaining its production over the last few years. Our Kolomela lump iron ore is in demand because of its excellent physical strength and high iron content.
Financial results overview
Highlights – year ended 31 December 2018 as published by Kumbo Iron Ore
Delivering sustainable shareholder returns
Now for the numbers we are interested in:
Delivering sustainable shareholder returns
- Strong cash generated from operations of R18.9 billion
- Headline earnings R30.28 per share
- Final cash dividend of R15.73 per share, total dividend of R30.24 per share
- Maintained fatality free record
- High potential incidents reduced by 67%
- Operating efficiency up from 58% to 65% of benchmark
- Product quality improved from 64.1% to an average Fe of 64.5%
- Average realised FOB export price of US$72/tonne
- Cost savings of R1 billion exceed target of R800 million
- EBITDA margin up 3 percentage points to 45%
Now for the numbers we are interested in:
- Revenue: R45.725 billion (down -1.4% from R46.379 billion in the prior year)
- Operating expenses: R29.365 (up 5.5% from R24.9 billion in the prior year)
- Profit for the year: R12.595 billion (down -21.9% from R16,207 billion in the prior year)
- Diluted earnings per share: R29.87 (down -22.15% from R38.37 a share in the prior year)
- PE ratio 12.92
- Total dividend for the full year: R30.24 (down -2.35% from R30.97 a share in the prior year)
- Dividend yield: 7.8%
- Cash generated from operations: R18.9 billion (down -15.7% from R22.43 billion in the prior year)
- Cash generated from operations per share: R58.71 a share
- Cash on balance sheet: R11.67 billion (down -15.9% from R13.87 billion in the prior year)
- Cash on balance sheet per share: R36 a share (or 9.3% of the company's current share price)
Management comment on the results
Themba Mkhwanazi, Chief executive of Kumba, said, "In 2018, Kumba continued to achieve important milestones in our strategy of unlocking our full potential through margin expansion and life of mine extension. We kept our commitment on safety and remained fatality-free with significant improvement across multiple safety indicators. Our focus on productivity and efficiency continued to gain traction improving by 7% as we reached 65% of benchmark. This, together with our drive to optimise costs, saw us realise close to R1 billion of cost savings against our target of R800 million.
"The flexibility in our approach to production allowed us to lift product qualities to an average of 64.5% Fe, enabling higher price realisation whilst mitigating logistical constraints. We achieved our production and sales volume guidance, with unit costs remaining well contained. This solid performance resulted in net cash generated from operations of R18.9 billion, which coupled with disciplined capital allocation, translated into a total dividend of R30.24 per share for the year. Furthermore, in line with our resource development plan, I am pleased to announce that we were granted the right to expand Kolomela into the adjacent Heuningkranz area which presents an exciting opportunity to extend our life of mine.
It is clear that alongside the solid performance achieved, Kumba has significant value to unlock. While challenges are part of the uncertain environment that we operate in, the quality of our assets ensures that we are well positioned to serve our diversified and growing customer base, and we have the right strategy and teams in place to create sustainable shareholder value."
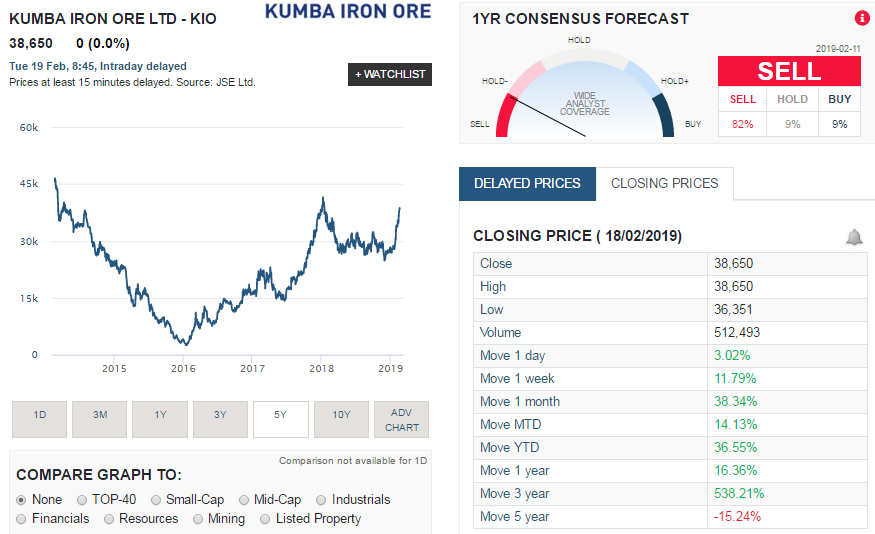
Kumba (KIO) share price performance
The screenshot of KIO taken from Sharenet below shows that KIO has rewarded shareholders over the short and medium term, with it providing positive growth so far this month, since the start of the year, over the last year and over the last 3 years, with just the returns over the last 5 years being negative: Below a summary of KIO's share price performance over various time periods:
- Last Week: 11.8%
- Month to Date (MTD) : 14.13%
- Year to Date (YTD): 36.55%
- 1 year move: 16.36%
- 3 year move: 538.2%
Kumba (KIO) share valuation
As we mentioned in the introduction, Kumbo Iron Ore shares surged since the start of the year after a tailing dam in Brazil belonging to Vale broke and the ensuing flooding killed almost 170 people lead to Vale suspending the production of Iron ore at the close by iron ore mines, which sent up iron ore prices on supply fears. But all of this happened in the new year and is not currently reflected in KIO's financial results, but it should have a positive impact on their next set of earnings. Based on this and KIO current financial results which places them on a PE ratio of less than 13 and a dividend yield of almost 8% with strong cash generation capacity and loads of cash on their balance sheet, we value the group at R446.68 a share. So we do believe there is value in the share and if the increase in iron ore prices due to the problems in Brazil for Vale filters through into Kumbo's earnings their next set of results will probably have bumper profits, in which investors can hope for a nice windfall divinde.