|
Related Topics |
|
In this article we focus on the economic performance of South Africa under the leadership of President Jacob Zuma. While his presidency was mared by scandal after scandal in not only his personal life, but also his political life, just how did South Africa's economy perform under him and his "Gupta" shadow government who was intent on plundering as much of South Africa's resources as they can while President Jacob Zuma was in charge.
|
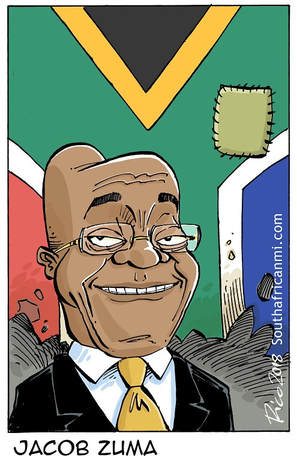
Jacob Zuma Caricature
|
So Zuma was more concerned about himself than South Africa's economy?
Well yes, thats the general impression that was created under the rule of Jacob Zuma. Poor policies, even poorer implementation, large scale corruption, favourtism, nepotism, cadre deployment, stripping the law enforcement agencies bare so that they dont have the will or the power to prosecute himself or his "connected" friends such as the Guptas, Brian Molefe, Anoj Singh etc. Lets be brutally honest, the performance of South Africa's economy was the furthest thing from President Jacob Zuma's mind, and it shows. The graphics and details below shows in detail the economic performance under President Zuma.
Quarterly GDP
The graphic below shows the quarter on quarter annualised seasonally adjusted GDP growth rates and the different colours represents the different presidents of the republic since the dawn of democracy. Amazingly that under President Zuma, the South African economy never actually entered a recession. But for 4 quarters in his rule, the country's economy contracted. And this while South Africa's population growth continued to boom. And if economic growth is lower than population growth, then essentially each citizen in the country is getting poorer as the economic pay we all share from is not growing faster than the number of people sharing the economic pie. Below the graphic showing the quartely GDP. President Zuma is represented by the light blue colour.
Under Jacob Zuma's rule, South Africa experienced an average GDP growth rate of 2.1% (quarter on quarter annualised) and inflation averaged 5.41%. This during a period in which commodity prices dropped off a cliff, then rose to new heights and dropped back down to multi year lows. Unfortunately SA did not diversify enough away from commodities during the good times, and it's economy is still very much linked to the fortunes of resources and commodities. Part of Zuma's saving grace when it comes to inflation which just managed to stay within the 3% and 6% target of the Reserve Bank under his tenure is the fact that crude oil prices declined steadily during this period which assisted in keeping the levels of inflation under control. and luckily for South Africans government of the day had no say in how the Reserve Bank operates, otherwise the inflation story might have turned out a lot differently. Sadly the continued drops in commodity prices are used as an excuse for poor economic growth under Zuma's watch, yet we never experienced massive economic growth when commodity prices were sky high. Cant have your bread buttered on both sides, so if we were to blame commodity prices for poor economic performance, the question has to be asked why did we not perform better with high commodity prices?
Luckily for South Africans the ANC finally woke up and recalled him, after which Zuma resigned. If Jacob Zuma did not resign a motion of no confidence in parliament would have removed him, as the country and all of its politicians got sick of Zuma and his cronies.
Luckily for South Africans the ANC finally woke up and recalled him, after which Zuma resigned. If Jacob Zuma did not resign a motion of no confidence in parliament would have removed him, as the country and all of its politicians got sick of Zuma and his cronies.
Rand/Dollar exchange rate
There is probably no better gauge of a country's economic performance, or the sentiment towards a country's economic fortunes and prospects than a country's exchange rate. A strong exchange rate shows that there is a strong demand for that country's currency, be it because of investors seeing it as a safe haven, or demand for the country's currency as companies and people are looking to invest there. On the flip side, a weak exchange rate shows investors, companies, traders etc are favouring other countries currencies instead of the local currency. And this could be due to various different reasons. A few of those include:
1. Slow or no economic growth
2. Political uncertainty
3. Policy uncertainty
4. High tax rates
5. Corruption and bureaucratic red tape
And sadly for South Africa over the course of Jacob Zuma's rule the 5 main points mentioned above are all relevant. While government was aiming for 6% growth to help in reducing the massively high unemployment rate, which averaged 55% under Jacob Zuma's rule, they managed a rather pathetic 2.1% during this period. And because investors, companies and individuals saw little to no progress being made in South Africa's economy, there started looking elsewhere to invest, and with that the currency started weakening. The graphic below shows the average exchange rate during each Presidents tenure in office.
When Jacob Zuma took office, the exchange rate was hovering around R7.22 to the US Dollar. By the time the ANC finally got rid of him as president, the average exchange rate during 2017, the last year of Jacob Zuma rule, was sitting at R13.31. Thats a whopping 84% depreciation (weakening of South Africa's exchange rate during President Zuma's rule). This is a clear sign that the markets, companies, investors and traders alike did not like where South Africa's economy was heading (and sadly for President Ramaphosa) and is still heading. Poor President Ramaphosa inherited an economy that is so sick and rotten with corruption one wonders if he would be able to stop the rot that has set in.
Unemployment under Zuma
No real surprise considering the sluggish economic growth, fruitless and wasteful expenditure by the state under Zuma and the poor policies and the implementation thereof that the unemployment rate increased in South Africa under his watch. When President Zuma took over from interim President Kgalema Motlanthe, the unemployment rate was sitting at 23.2%. By the time Zuma was finally kicked out of office by the ANC the unemployment rate was sitting at 26.7%. With the average unemployment rate under Jacob Zuma sitting at 25.4%. So he might have started his political ascent by claiming to be standing and fighting for the poor. But based on the increase in unemployment under his watch, it seems he drove more people into poverty than helping them out of it. Except of course for himself, and his Gupta friends. They all became multimillionaires by funneling state finds into dodgy contracts given to their business interests.