|
|
Related Topics
|
About Italtile
Italtile limited is a leading retailer and manufacturer of tiles, bathroomware and related products. The Group operates as a national franchisor of its three high profile retail brands, Italtile Retail, CTM and TopT. The retail operations are underpinned by an extensive property portfolio and a vertically integrated supply chain comprising International Tap Distributors (an importer and distributor of brassware and accessories), and Cedar Point, (an importer of shower enclosures, laminated boards, cabinets, sanitaryware, décor and tiling tools). The Group holds controlling interests in both businesses. The Group’s Distribution Centre sources imported products and provides warehousing and distribution facilities to the retail brands. Effective 2 October 2017, the Group acquired controlling stakes in its key suppliers, tile and sanitaryware manufacturer, Ceramic Industries (Pty) Ltd and adhesives and related products manufacturer, Ezee Tile.
Woolworths East London 1948
Trading Statement
VOLUNTARY TRADING STATEMENT FOR THE YEAR ENDED 30 JUNE 2019 Italtile is currently finalising its results for the year ended 30 June 2019 (“the review period”).
IMPACT OF CERTAIN TRANSACTIONS ON THE GROUP’S RESULTS AND REPORTING REFERENCE TERMS
Comparable disclosure and analysis of the Group’s results for the review period with the prior corresponding period have been impacted on by the acquisition of Ceramic Industries Proprietary Limited (“Ceramic”) (“Acquisition”) as set out in the circular to shareholders of Italtile dated 23 August 2016, which became effective on 2 October 2017 and the partially underwritten renounceable rights offer as set out in the circular to shareholders of Italtile dated 6 November 2017 (“Rights Offer”).
ACQUISITION
Following the Acquisition, the Group holds a 95.47% stake in Ceramic and an effective 71.54% in Ezee Tile Adhesive Manufacturing Proprietary Limited (“Ezee Tile”). Accordingly, the results for the year under review include the consolidated results of both businesses for the full year from 1 July 2018 to 30 June 2019 versus the nine-month period from 2 October 2017 to 30 June 2018 in the prior corresponding period. Sales related to Ceramic and Ezee Tile are referred to as “manufacturing” sales to distinguish them from “retail” sales reported by Italtile’s retail brands, CTM, Italtile Retail and TopT.
ISSUED SHARE CAPITAL AND WEIGHTED AVERAGE NUMBER OF SHARES
In terms of the Acquisition, 150 936 170 Italtile shares were issued to shareholders of Ceramic. Further, in terms of the Rights Offer, 135 985 156 Italtile shares were subscribed for by the close of the Rights Offer on 24 November 2017. In addition, in terms of a specific repurchase of shares (“Repurchase”) as published on SENS on 8 March 2018, 25 000 000 Italtile shares were repurchased by Italtile from Four Arrows Investments 256 Proprietary Limited. As a result of the above, the Group’s current issued share capital is 1 295 254 148 shares, reflecting an increase of 25.35% (pre- Acquisition, Rights Offer and Repurchase: 1 033 332 822 shares). Consequently, the weighted average number of shares in the review period is 7.6% higher than that of the prior corresponding period.
OVERVIEW
The weak trading conditions and negative consumer sentiment experienced in the first half of the year under review persisted over the balance of the 12 months, deteriorating notably since April 2019. In light of high levels of personal indebtedness, unprecedented unemployment and hikes in VAT, fuel and utility costs, disposable income remained constrained. In addition, meaningful investment by both the public and private sectors was curtailed or deferred in the context of country-specific risk factors including uncertainty regarding the outcome of the national election and general policy direction, endemic corruption, sustained dissatisfaction with poor service delivery and inconsistent power supply.
RESULTS
Following the Group’s creditable performance in the first half of the year under review, management cautioned in February 2019 that while solid headline earnings growth could be achieved in the second half, growth would not be at the same level as the prior corresponding period. This forecast was based on the very strong double-digit increase in headline earnings achieved off a low base in the prior comparable period (January 2018 to June 2019), derived from major improvements in efficiencies and cost cutting across the business, and the consolidation of Ceramic and Ezee Tile for the full six-month period. In line with this forecast, and notwithstanding the worsening of trading conditions over the year, the Group has achieved its stated goal of delivering improved headline earnings growth for the review period.
Management is satisfied that the results to be reported are a good reflection of the Group’s:
- resilient business model and robust 50-year trading record;
- unwavering efforts to better execute retail excellence principles;
- strong cash generative nature, disciplined cash management and cost leadership; and
- leveraging of growth opportunities in the business through an unrelenting focus on the customer.
The Group’s system-wide turnover for the review period was R10.0 billion, 15.2% higher than the prior corresponding period (2018: R8.7 billion). System-wide turnover is defined as the aggregate of the Group’s consolidated turnover (total sales by Group-owned entities and corporate stores, excluding sales from owned supply chain businesses to corporate stores) and the retail turnover of franchisees of the Group. Total retail store turnover grew 6.1% for the review period compared to the previous corresponding period, with average selling price inflation estimated at 2.7%. Like-on-like retail store turnover (excluding sales of new stores opened and stores closed during the period), increased by 4.2% compared to the prior corresponding period. Retail store turnover is defined as the aggregate turnover of all stores, either corporate or franchised, in the Group’s retail network.
Manufacturing sales included in the consolidated results for the year under review grew by 36.5% compared to the previous corresponding period, which included only nine months of trading from October 2017. Manufacturing sales for the period 1 July 2018 to 30 June 2019 rose by 1.4% compared to the same period in the prior year. Average selling price inflation for the review period is estimated at 3.0%. The Group’s basic earnings per share is expected to be between 101.7 cents and 103.6 cents (2018: 95.0 cents), representing an increase of between 7.0% and 9.0% compared to the prior corresponding period. Headline earnings per share is expected to be between 100.7 cents and 102.6 cents (2018: 95.0 cents), reflecting an increase of between 6.0% and 8.0% compared to the prior corresponding period. The disparity between basic earnings and headline earnings growth is attributable to net profits of R12 million realised on the disposal of local properties.
REVIEW OF RESULTS
The information on which this announcement is based has not been reviewed or reported on by Italtile's auditors.
PUBLICATION OF RESULTS
The Group's results for the year ended 30 June 2019 are expected to be published on SENS on or about 22 August 2019.
END SENS
Italtile (ITE) share price performance over last 5 years
The image below, taken from Sharenet shows Italtile's share price performance over the last 5 years. and we must say the share price has held up pretty well considering the industry they operate in.
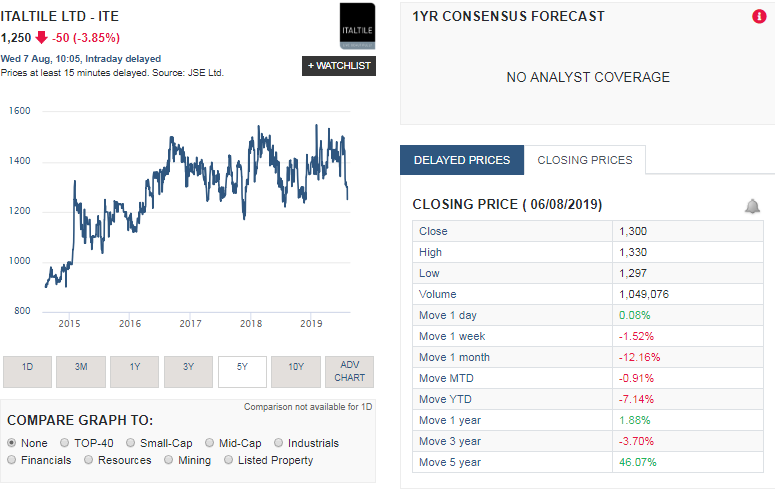
The summary below shows the share price returns of Italtile over various time periods:
The above shows that over the very short term Italtile has been struggling but when taking a long term view such as the last 5 years, the group actually provided shareholders with pretty decent returns. It should be noted that it is not the most liquid stock around so it doesn't change hands to often, and this might have been providing some protection for the group's share price over the years.
- 1 week: -1.52%
- 1 month: -12.16%
- Year to date (YTD): -7.14%
- 1 year: 1.88%
- 3 years: -3.70%
- 5 years: 46.07%
The above shows that over the very short term Italtile has been struggling but when taking a long term view such as the last 5 years, the group actually provided shareholders with pretty decent returns. It should be noted that it is not the most liquid stock around so it doesn't change hands to often, and this might have been providing some protection for the group's share price over the years.