|
Related Topics |
|
In our continued efforts to give our readers a broad number of views, opinions and information, we continue to provide PSG's daily market updates and add our own daily inputs in at the end.
|

|
Short summary of PSG's market commentary for 4 October 2019
South Africa
The JSE ended lower on Thursday amid a selloff in global equities as recession and trade war fears weighed on risk assets. At the closing bell, the JSE All Share lost 0.51%.
United States
Wall Street indices were steady on Thursday as investors looked for new catalysts from services data. Just after the JSE closed, the S&P 500 gained 0.20%.
Europe
European markets surged on Thursday following a stellar performance by aerospace company Airbus and luxury goods makers. Shortly after the JSE closed, France’s CAC 40 gained 0.30%.
Hong Kong
Hong Kong stocks were mixed on Thursday after Washington threatened to impose tariffs on over $7 billion worth of European Union imports. Both the US and China have enacted tariffs on each other’s goods in a prolonged trade spate that has increased the risk of a global recession. The Hang Seng closed 0.26% in the green.
Japan
Japanese stocks plunged on Thursday after the US fanned trade war concerns by threatening to impose tariffs on European Union goods. At 18h10, the Nikkei had lost 2.01%.
Rand
The rand made solid gains on Thursday as investors digested the ANC's plans to boost the domestic economy. At 18h15, a dollar traded at R15.14.
Precious metals
Gold prices went up on Thursday amid simmering trade tensions which created heightened uncertainty for the global economic outlook. An ounce of spot gold traded at $1 510.37 at 18h15.
Oil
Oil prices slid on Thursday on the back of heightened concerns over slowing global growth and oil demand. At 18h20, a barrel of Brent crude traded at $57.66.
Advertisement (and yes South Africans can buy from Amazon as they deliver to SA)
Our daily update
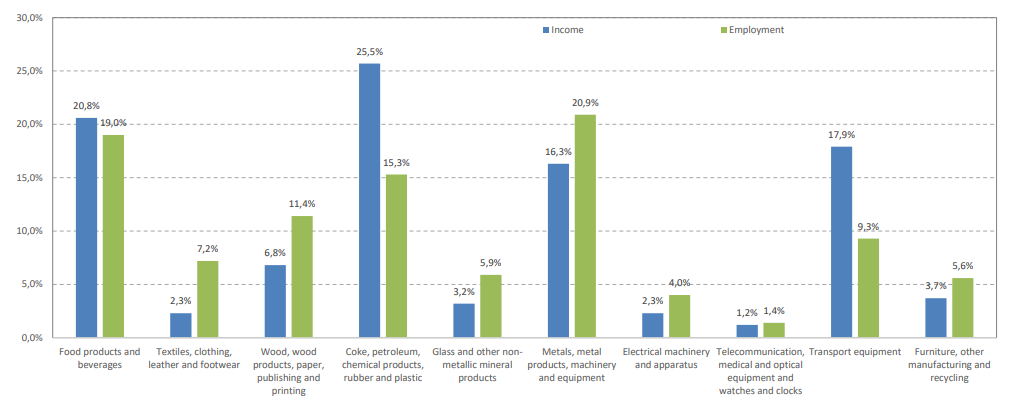
Yesterday we covered a report on Manufacturing by Statistics South Africa and we highlighted a specific graphic which shows the contribution to income earned and total employment in the manufacturing industry by various manufacturing sub industries. While clothing and textiles contributes a lot to employment in the manufacturing sector the income earned is very low.
Read the full article here
Read the full article here
Our JSE All Share index daily performance calendar
Visit our JSE Calendar tracker page for a expanded version of the calendar below
The graphic below provides the daily returns of the JSE All Share Index (J203) on a calendar chart. Provides a great overview of the All share index over the course of the month. It will be updated daily with our daily investment update as received from PSG.
While the month of August was negative by -1.73% lets see what the month of September holds for the South African stock market.
So for the month September 2019 the JSE All Share Index ended the month down -2.01%. And October 2019 is of to horrid start with the first trading week of October 2019 looking set to end firmly in the red.
There continues to be concerns about a global economic slow down largely driven by the trade ware between the US and China. Continued tariffs by the US on Chinese goods and the retaliation by China by raising tariffs on US goods keeps hurting markets and global economic growth, as the world's two biggest economies continue to stand off in this trade war. Added to market worries is the impeachment investigation currently taking place against President Donald Trump due to him asking Ukraine's president to investigate his political rivals, which most believe is a clear abuse of his powers.
For more on daily market movements see our 2019 Calendar tracker.
But we as South African investors are losing out in Dollar terms. Largely due to continued Rand weakness not only over the short term but over the last couple of years. We continue to advise investors to take money out of South Africa and invest it offshore. Looking for ideas for investments to make? Go read this article