|
Related Topics |
|
In our continued efforts to give our readers a broad number of views, opinions and information, we continue to provide PSG's daily market updates and add our own daily rant at the end.
|

|
Short summary of PSG's market commentary for 24 January 2019
South Africa
The local bourse ended lower on Wednesday taking its cue from Asian markets amid fears of an escalating trade war between the US and China. Trimmed global growth forecasts from the IMF together with poor economic data from China continued to dampen sentiment. The All Share ended the day down 0.28%.
United States
Major losses in the healthcare and financial sectors led to a day of choppy trade on US markets, while the Dow remained steady on positive earnings reports from IBM, United Technologies and Procter & Gamble. At the close of business, the S&P 500 was up 0.22%.
Europe
European shares tumbled on Wednesday afternoon after a batch of poor corporate earnings releases alarmed investors, fuelling apprehensions over an already gloomy global growth outlook. At close of business, the FTSE 100 was down 0.85%.
Hong Kong
Hong Kong shares were flat on Wednesday on the familiar array of concerns over a decelerating global economy and an escalating trade war between the US and China. The Hang Seng ended the day 0.01% higher.
Japan
Poor export data for December together with fears of a trade war between the world’s largest economies dragged the Nikkei through the mud on Wednesday, although a weakened yen eased pressure on exporters. The Nikkei share average lost 0.14%.
Rand
The release of SA’s CPI figure for December prompted a weakened local currency as market focus remained on the threat of a US-Sino trade war. As expected, inflation eased to 4.50% in December on the steep petrol price cuts in the last leg of 2018. At 19h30, the rand traded R13.84 against the dollar.
Precious metals
Gold prices remained steady on Wednesday as investors sought refuge in the safety of bullion after global equities tumbled amid concerns of a decelerating global economy and the US-China trade spate. At 19h30, Spot gold stood at $1 285.55 an ounce.
Oil
Oil prices edged higher on Wednesday on optimism that Asian leaders will implement a fiscal stimulus programme that will halt an economic slowdown that has weighed on global financial markets. At 19h30, benchmark Brent crude was trading at $60.41 a barrel.
Our daily rant..
We mentioned in yesterday's update that the listed retailers and wholesalers in South Africa have been struggling big time and their share price declines showed it. We compared Massmart (MSM) to Woolworths (WHL), Mr Price (MRP) and Shoprite (SHP) and they all showed significant share price declines. See full article and comparison here.
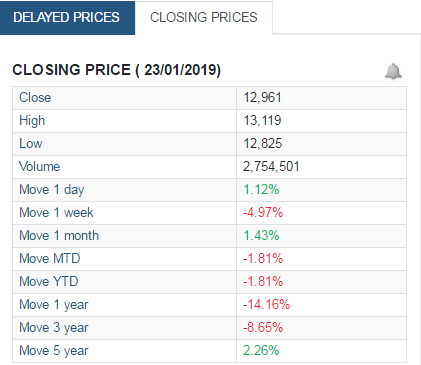
In today's rant we take a look at the share price performance of Vodacom after they announced pretty weak trading update numbers for the quarter ending December 2018. A few of the salient features of the update that came out today:
- Group revenue up 1.5% (0.7%*) to R23.0 billion and service revenue up 2.4% (1.6%*) to R18.9 billion
- Group customers increased 7.1% to 79 million, up 5.4% in South Africa and 9.3% in our International operations
- Group data revenue increased 2.2% to R6.8 billion; International data revenue grew 25.4% (21.3%*)
- South Africa service revenue declined 0.9% to R13.9 billion, impacted by pricing transformation and customers optimising promotional data bundle allocations
- International service revenue increased 13.2% (9.4%*) to R5.2 billion#, driven by strong commercial execution
More on that here. The screenshot of Vodacom's share price performance was taken off www.Sharenet.co.za
Our JSE All Share index daily performance calendar
The graphic below provides the daily returns of the JSE All Share Index (J203) on a calendar chart. Provides a great overview of the All share index over the course of the month. It will be updated daily with our daily investment update as received from PSG.
For the month of January 2019 so far, the JSE All share index is up by 2.23%. Wednesday the 2nd saw its worse day of the month, while Wednesday the 9th saw the JSE All share record its best performing day of the month so far.