South African Market Insights
  • Home
  • Blog
    • Blog-5Jun2018
    • Blog-18May2018
    • Blog-16May2018
    • Blog-3May2018
    • Blog-2May2018
    • Blog-30Apr2018
    • Blog-26Apr2018
    • Blog-24Apr2018
    • Blog-18Apr2018
    • Blog-17Apr2018
    • Blog-16Apr2018
    • Blog-3Apr2018
    • Blog-22Mar2018
    • Blog-20Mar2018
    • Blog-19Mar2018
    • Blog-23Oct2017
    • Blog-20Oct2017
    • Blog-11Oct2017
    • Blog-10Oct2017
    • Blog-6Oct2017
    • Blog-3Oct2017
    • Blog-2Oct2017
  • Economics
    • Rand Dollar Exchange Rate
    • South Africa's GDP
    • South Africa's Unemployment
    • SA by numbers
    • Economic Progress Index
    • Taylors Rule
    • South Africa's Formal Business Sector
    • South-Africa's-Fiscal-Policy
    • SA EU Trade Data
    • Inflation Heat Map
    • Population Density Map
    • Labour Market Dynamics
    • Estimating the Size of the Informal Economy
    • SA Consumer Spending Patterns
    • South Africa's Monetary Fiscal Policy Mix
    • GDP Animations >
      • SouthAfrica
      • WesternCape
      • EasternCape
      • NorthernCape
      • FreeState
      • KwaZuluNatal
      • NorthWest
      • Gauteng
      • Mpumalanga
      • Limpopo
    • South Africa's Economic Structure
    • South Africa's Economic History
    • South Africa's Trade Data Page
    • South Africa's Food and Beverages Sector
    • Financial Well-being of South African Companies_2015
    • SA vs the World
    • Budget Day Page (24 Feb 2016)
  • Stock in Focus
    • JSE ALSI Chart
    • Sector Comparison Page
    • JSE-Calendar-Tracker-2019
    • Adcorp (ADR)
    • Amazon (AMZN)
    • Apple (AAPL)
    • Ascendis (ASC)
    • AVI (AVI)
    • Bidvest (BVT)
    • Blue Label Telecoms (BLU)
    • Bowler Metcalf (BCF)
    • Capitec (CPI)
    • City Lodge Hotel Group
    • Clicks Group (CLS)
    • Coronation (CML)
    • Curro Holdings (COH)
    • Discovery (DSY)
    • Distell (DST)
    • EOH (EOH)
    • Famous Brands (FBR)
    • Ferrari (RACE)
    • FirstRand Group (FSR)
    • Grindrod (GND)
    • GrowthPoint (GRT)
    • Holdsport (HSP)
    • Harley-Davidson (HOG)
    • Hyprop (HYP)
    • Hyprop (HYP)_1Jun2016
    • Investec Property Fund (IPF)
    • JSE (JSE)
    • Massmart (MSM)
    • MediClinic (MEI)
    • MTN (MTN)
    • MTN (MTN)_May2016
    • Mr Price Group (MRP)
    • Mr Price Group (MRP)_8APR2016
    • Nedbank (NED)
    • OneLogix (OLG)
    • Peregrine Holdings (PGR)
    • Pick 'n Pay Stores (PIK)
    • Pioneer Foods (PFG)
    • PSG Group (PSG)
    • Quantum Foods (QFH)
    • RCL Foods (RCL)
    • Remgro (REM)
    • Richemont (CFR)
    • RMB Holdings (RMH)
    • Rolfes (RLF)
    • Sanlam (SLM)
    • Sasol (SOL)
    • Sasol (SOL)_18sep2016
    • Santova (SNV)
    • Spar Group (SPP)
    • Shoprite Holdings (SHP)
    • Spur Corporation (SUR)_7Sep2017
    • Standard Bank (SBK)
    • Steinhoff International Holdings (SNH)
    • Stor-Age (SSS)
    • Super Group (SPG)
    • Taste Holdings (TAS)_30May2016
    • The Foshini Group (TFG)
    • Value Logistics (VLE)
    • Vodacom (VOD)
    • Wilson Bayly Holmes Ovcon (WBO)
    • Woolworths (WHL)
    • Woolworths (WHL)_24Aug2017
    • Zeder (ZED)
  • Online Calculators
    • Rand Petrol Price Estimator
    • Share Valuation
    • Financial Ratios Calculator
    • GDP Growth Estimator
    • Future Value of Investment Calculator
    • Loan repayment calculator
  • Contact
  • About
  • Search

< South Africa's GDP
Economics Main Page >

PSG daily investment update 21 February 2019

​​​Date: 21 February 2019
Category: Stock Market

Related Topics

In our continued efforts to give our readers a broad number of views, opinions and information, we continue to provide PSG's daily market updates and add our own daily rant at the end.
Picture
  • JSE Calendar Tracker 2019
  • JSE All Share Sunburts chart
  • ​JSE All share pie chart

Short summary of PSG's market commentary for 21 February 2019

South Africa
While investors were still digesting the impact of Wednesday’s budget speech, miners took the lead by boosting the local market’s performance. At the close of trade, the All Share had risen by 0.90%. 

United States
Hopes that the US and China would reach a trade agreement were counterbalanced by weak earnings reports, leading to a flat open for US indices on Wednesday. At 18h50, the Nasdaq was 0.19% in the green.

Europe
On Wednesday European market losses, caused by Swedbank’s money laundering scandal and the blocked Sainsbury’s merger, were offset by optimism around the US-China trade talks. At the end of business, the STOXX 600 was 0.67% up. 

Hong Kong
Asian indices enjoyed gains on Wednesday as renewed tariff negotiations between the US and China lifted investor optimism. At 18h50, the Hang Seng traded 2.20% higher.

Japan
The Nikkei’s rise extended into Wednesday as positivity over trade discussions elevated cyclical stocks in the auto industry. At 18h50, the Nikkei had increased by 2.54%.

Rand
The local currency faced a roller coaster day on Wednesday; however, by the end of Finance Minister Tito Mboweni’s budget address, it had recovered somewhat. At 18h50, a dollar cost R14.01. 

Precious metals
Bullion prices continued its bullish run on Wednesday – gold reached a 10-month high and palladium recorded prices above $1 500 per ounce. At 18h50, an ounce of gold cost $1 345.75.

Oil
Although sanctions placed on Iran and Venezuela boosted the oil price lately, it fell on Wednesday due to a rise in US shale output forecasts. At 18h50, Brent crude traded at $66.45 per barrel. 

Our daily rant.. 

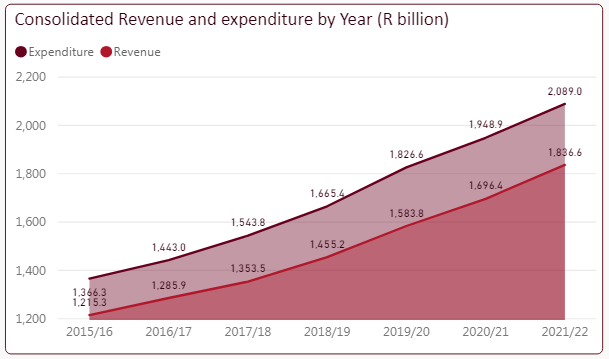
So budget 2019 came and went. And its not a pretty picture for South Africans or the South African government. The images below shows the South African Minister of Finance, Tito Mboweni and the image on the right shows government's expected revenue and expenditure for the next three years from 2019/2020 to 2021/2022.
Picture
South Africa's Finance Minister: Tito Mboweni
Picture
So lets break down the expected revenue and expenditure of the South African government as shown in the image above.

2019/2020
  • Revenue: R1.583 trillion
  • Expenditure: R1.826 trillion
  • Deficit:  R243 billion
What this means is that of the 220 odd working days a year, South Africa's government will be borrowing  around R1.1 billion a day. And all that money plus interest needs to be paid back. South Africa's government''s debt servicing costs will soar and in future more money will be paid servicing debt instead of delivering services. If this is not the wake up call needed for South Africans and the South African government to curb its spending (especially on bailing out SOE's such as ESKOM, SAA, Denel etc) then nothing will shake this government out of the rut they are stuck in

2020/2021
  • Revenue: R1.696 trillion
  • Expenditure: R1.949 trillion
  • Deficit:  R253 billion

2021/2022
  • Revenue: R1.837 trillion
  • Expenditure: R2.089 trillion
  • Deficit: R252 billion

​At R252 billion SA's government will borrow roughly R1.14 billion a day! Let that sink in. Imagine how many houses government could build for the poor with just the interest that will be paid on all these borrowings.  See more regarding South Africa's Fiscal policy here.​

Our JSE All Share index daily performance calendar 

Visit our JSE Calendar tracker page for a expanded version of the calendar below

The graphic below provides the daily returns of the JSE All Share Index (J203) on a calendar chart. Provides a great overview of the All share index over the course of the month. It will be updated daily with our daily investment update as received from PSG.
The first trading day of February ended in the red. In contrast to January in which every Friday ended the day in the green, so far for February 2019 every Friday has ended in the red. So far the market has increased by 2.85% during the 20 days of February 2019. Its been a relatively directionless month for the stock market, with movements flip flopping between positive and negative. But in saying that fears regarding the trade ware between USA and China are easing, which means "risk on" assets such as shares listed in Emerging markets (EM) such as South Africa is in higher demand again pushing up demand and prices of locally listed shares slight in recent trading days. 

Newsletter Subscription:

    Please enter your email address below to subscribe to our newsletter. It will be ad hoc newsletters and we wont bombard your email inbox with emails. We will NEVER supply your contact details to any third party.

Subscribe to Newsletter

Additional content

Related Topics

  • ​JSE Calendar Tracker 2019
  • JSE All Share Sunburts chart
  • ​JSE All share pie chart


​Homepage

Economics Page
Stock in Focus Page


​About


Contact Us

Copyright © 2015
  • Home
  • Blog
    • Blog-5Jun2018
    • Blog-18May2018
    • Blog-16May2018
    • Blog-3May2018
    • Blog-2May2018
    • Blog-30Apr2018
    • Blog-26Apr2018
    • Blog-24Apr2018
    • Blog-18Apr2018
    • Blog-17Apr2018
    • Blog-16Apr2018
    • Blog-3Apr2018
    • Blog-22Mar2018
    • Blog-20Mar2018
    • Blog-19Mar2018
    • Blog-23Oct2017
    • Blog-20Oct2017
    • Blog-11Oct2017
    • Blog-10Oct2017
    • Blog-6Oct2017
    • Blog-3Oct2017
    • Blog-2Oct2017
  • Economics
    • Rand Dollar Exchange Rate
    • South Africa's GDP
    • South Africa's Unemployment
    • SA by numbers
    • Economic Progress Index
    • Taylors Rule
    • South Africa's Formal Business Sector
    • South-Africa's-Fiscal-Policy
    • SA EU Trade Data
    • Inflation Heat Map
    • Population Density Map
    • Labour Market Dynamics
    • Estimating the Size of the Informal Economy
    • SA Consumer Spending Patterns
    • South Africa's Monetary Fiscal Policy Mix
    • GDP Animations >
      • SouthAfrica
      • WesternCape
      • EasternCape
      • NorthernCape
      • FreeState
      • KwaZuluNatal
      • NorthWest
      • Gauteng
      • Mpumalanga
      • Limpopo
    • South Africa's Economic Structure
    • South Africa's Economic History
    • South Africa's Trade Data Page
    • South Africa's Food and Beverages Sector
    • Financial Well-being of South African Companies_2015
    • SA vs the World
    • Budget Day Page (24 Feb 2016)
  • Stock in Focus
    • JSE ALSI Chart
    • Sector Comparison Page
    • JSE-Calendar-Tracker-2019
    • Adcorp (ADR)
    • Amazon (AMZN)
    • Apple (AAPL)
    • Ascendis (ASC)
    • AVI (AVI)
    • Bidvest (BVT)
    • Blue Label Telecoms (BLU)
    • Bowler Metcalf (BCF)
    • Capitec (CPI)
    • City Lodge Hotel Group
    • Clicks Group (CLS)
    • Coronation (CML)
    • Curro Holdings (COH)
    • Discovery (DSY)
    • Distell (DST)
    • EOH (EOH)
    • Famous Brands (FBR)
    • Ferrari (RACE)
    • FirstRand Group (FSR)
    • Grindrod (GND)
    • GrowthPoint (GRT)
    • Holdsport (HSP)
    • Harley-Davidson (HOG)
    • Hyprop (HYP)
    • Hyprop (HYP)_1Jun2016
    • Investec Property Fund (IPF)
    • JSE (JSE)
    • Massmart (MSM)
    • MediClinic (MEI)
    • MTN (MTN)
    • MTN (MTN)_May2016
    • Mr Price Group (MRP)
    • Mr Price Group (MRP)_8APR2016
    • Nedbank (NED)
    • OneLogix (OLG)
    • Peregrine Holdings (PGR)
    • Pick 'n Pay Stores (PIK)
    • Pioneer Foods (PFG)
    • PSG Group (PSG)
    • Quantum Foods (QFH)
    • RCL Foods (RCL)
    • Remgro (REM)
    • Richemont (CFR)
    • RMB Holdings (RMH)
    • Rolfes (RLF)
    • Sanlam (SLM)
    • Sasol (SOL)
    • Sasol (SOL)_18sep2016
    • Santova (SNV)
    • Spar Group (SPP)
    • Shoprite Holdings (SHP)
    • Spur Corporation (SUR)_7Sep2017
    • Standard Bank (SBK)
    • Steinhoff International Holdings (SNH)
    • Stor-Age (SSS)
    • Super Group (SPG)
    • Taste Holdings (TAS)_30May2016
    • The Foshini Group (TFG)
    • Value Logistics (VLE)
    • Vodacom (VOD)
    • Wilson Bayly Holmes Ovcon (WBO)
    • Woolworths (WHL)
    • Woolworths (WHL)_24Aug2017
    • Zeder (ZED)
  • Online Calculators
    • Rand Petrol Price Estimator
    • Share Valuation
    • Financial Ratios Calculator
    • GDP Growth Estimator
    • Future Value of Investment Calculator
    • Loan repayment calculator
  • Contact
  • About
  • Search