|
Related Topics |
|
In our continued efforts to give our readers a broad number of views, opinions and information, we continue to provide PSG's daily market updates and add our own daily inputs in at the end.
|

|
Short summary of PSG's market commentary for 12 August 2019
South Africa
Although the JSE ended the week on a high note, it still recorded a loss for the week. On Thursday, better-than-expected Chinese data and a steady yuan boosted the local market. At the closing bell, the Top 40 stood 0.74% in the green.
United States
US markets opened up on Thursday, lifted by surprisingly upbeat Chinese economic data and the settled Chinese currency. At 17h30, the DJ Industrial was 0.82% higher.
Europe
European indices ended Thursday in the green thanks to bond yields and the yuan stabilising as well as the better-than-expected Chinese trade data. The FTSE 100 closed 0.93% in the green.
Hong Kong
Thursday saw Asian shares rise on the back of surprisingly positive Chinese trade reports and the yuan’s fall being capped. The Hang Seng ended the day 0.39% up.
Japan
The Nikkei ended four consecutive days of losses on Thursday due to investors “bargain-hunting” despite fragile sentiment. At the closing bell, the Japanese index had gained 0.37%.
Rand
On Thursday, the local currency reached its lowest point in 11-months, as investors digested the severe global risk-off trade and the Moody’s warning about Eskom. At 17h30, the rand traded R15.03 against the dollar.
Precious metals
Gold prices fell slightly on Thursday after rising over 17% in 2019 and as much as $100 in the past weekGold prices fell slightly on Thursday after rising over 17% since the beginning of the year and as much as $100 in the past week. Despite this drop, experts anticipate it to increase further. At 17h30, an ounce of spot gold traded at $1 497.13.
Oil
Oil prices made up some ground on Thursday, jumping over $1 per barrel, because of the stabilising yuan and possible future production cuts. At 17h30, Brent crude was trading at $57.68 per barrel.
Our daily update
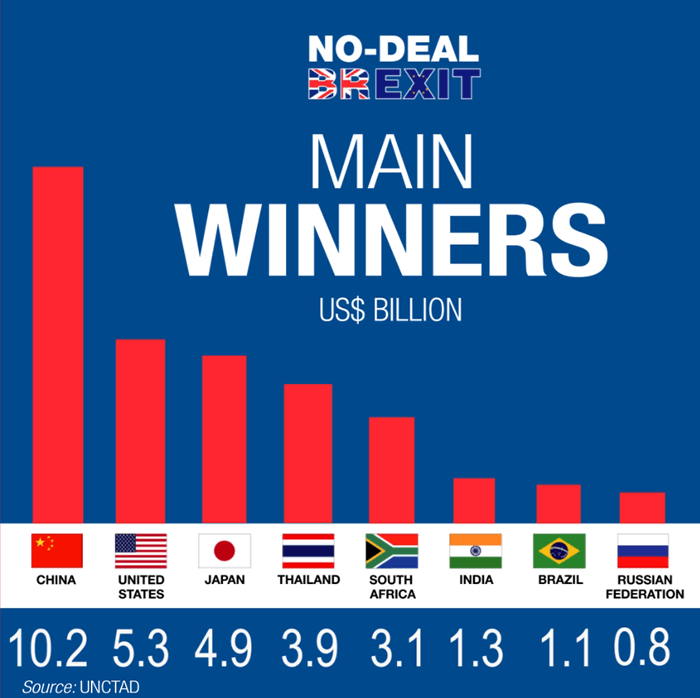
UNCTAD recently published an article in which it stated that South Africa stands to gain about $3.1 billion in trade with the UK if a no deal Brexit takes place. So while the Brexit chaos might hurt a large number of countries including the UK itself, South Africa stands to gain substantially from it.
Read full article here
Read full article here
Our JSE All Share index daily performance calendar
Visit our JSE Calendar tracker page for a expanded version of the calendar below
The graphic below provides the daily returns of the JSE All Share Index (J203) on a calendar chart. Provides a great overview of the All share index over the course of the month. It will be updated daily with our daily investment update as received from PSG.
So the South African stock market is still up substantially for the year, with the only negative months so far being the month of May in which markets pulled back pretty sharply. But the markets rebounded in June with it ending up close to 5% for the month.
The JSE All Share Index ended the month of July down by -2.36%. Only the second negative month for the JSE in 2019. So far August has gotten off to a horrible start, with the JSE All Share index losing -1.99% so far in August 2019. The strong decline for August 2019 is largely driven by the trade and currency war going on between the United States and China.
For more on daily market movements see our 2019 Calendar tracker.
But we as South African investors are losing out in Dollar terms. Largely due to continued Rand weakness not only over the short term but over the last couple of years. We continue to advise investors to take money out of South Africa and invest it offshore. Looking for ideas for investments to make? Go read this article