|
Related Topics |
|
We take a look at the trading statement released by Grindrod (GND) for the year ending December 2018. We have a soft spot for the group as we are fascinated by the trade and shipping industry that they are extremely active in
|

|
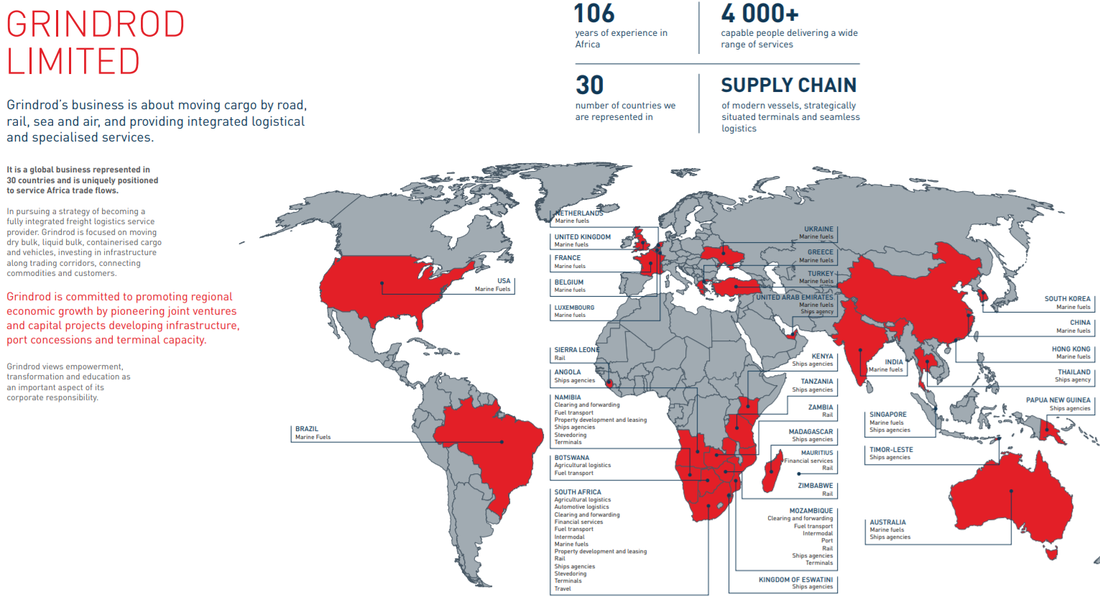
About Grindrod (GND)
Grindrod Limited is the holding company of a dynamic organisation listed on the JSE securities exchange with more than 100 years experience in South Africa’s freight movement and related industries. Grindrod's business is all about moving cargo by road, rail, sea and air, providing integrated logistical and specialised services en route. It is a global business represented in more than 30 countries and is uniquely positioned to service Africa trade flows.
In pursuing a strategy of becoming a fully integrated freight logistics service provider. Grindrod is focused on moving dry bulk, liquid bulk, containerised cargo and vehicles, investing in infrastructure along trading corridors, connecting commodities and customers.
Grindrod is committed to promoting regional economic growth by pioneering joint ventures and capital projects developing infrastructure, port concessions and terminal capacity. Grindrod views empowerment, transformation and education as an important aspect of its corporate responsibility.
The image below shows the geographical coverage of GrindRod
Grindrod's trading statement released today
SENS starts
Renewed focus on Freight Services, following Shipping’s separate listing in June 2018, is yielding positive results. Furthermore, while its repositioning is ongoing, earnings growth generated by Financial Services is pleasing.
Grindrod expects headline earnings from continuing operations, for the year ended 31 December 2018 to be between R707 million and R727 million, an increase of between 24% and 27%, compared to headline earnings of R570.8 million generated in 2017. Earnings from continuing operations for the same period are expected to be between R793 million and R813 million, an increase of between 23% and 26% compared to earnings of R646.3 million achieved in 2017. As a result of the above, shareholders are advised that headline earnings per share from continuing operations are expected to be between 94.0 cents and 96.7 cents, an increase of between 24% and 27% compared to the headline earnings per share of 76.0 cents achieved in 2017. Earnings per share of between 105.5 cents and 108.1 cents are expected, an increase of between 23% and 26% compared to earnings per share of 86.0 cents achieved in 2017.
Discontinued operations, which include Shipping and Rail Leasing, are expected to generate earnings of between R2 032 million and R2 052 million. As reported in the first half, results include the foreign currency translation gain that arose from separate listing of Shipping and the impairment of some locomotives in the leasing fleet. Overall earnings for the year ended 31 December 2018 are expected to be between R2 825 million and R2 865 million, an improvement in excess of 100% from the reported loss of R582.7 million in 2017. Headline earnings for both continuing and discontinued operations for the same period are expected to be between R466 million and R506 million, an improvement of in excess of 100% from the reported headline loss of R356.0 million in 2017.
Shareholders are advised that combined headline earnings per share from continuing and discontinued operations are expected to be between 62.0 cents and 67.3 cents, an improvement from the reported headline loss per share of 47.4 cents in 2017. Earnings per share of between 375.7 cents and 381.0 cents are expected, an improvement from the reported loss per share of 77.6 cents in 2017.
The information contained in this trading statement has not been reviewed nor reported on by the company’s external auditors. Grindrod will release its final results to shareholders on Wednesday, 6 March 2019 and will be holding an investor presentation in Johannesburg on that day.
SENS end
So pretty positive news for Grindrod, in that it's headline earnings per share, the main measure of profitability that we look out for shows an improvement of between 24% and 27%. Grindrod shareholders certainly need some good news. As the screenshot below taken from Sharenet shows, the share price performance of the group over the last 5 years has been pretty depressing.
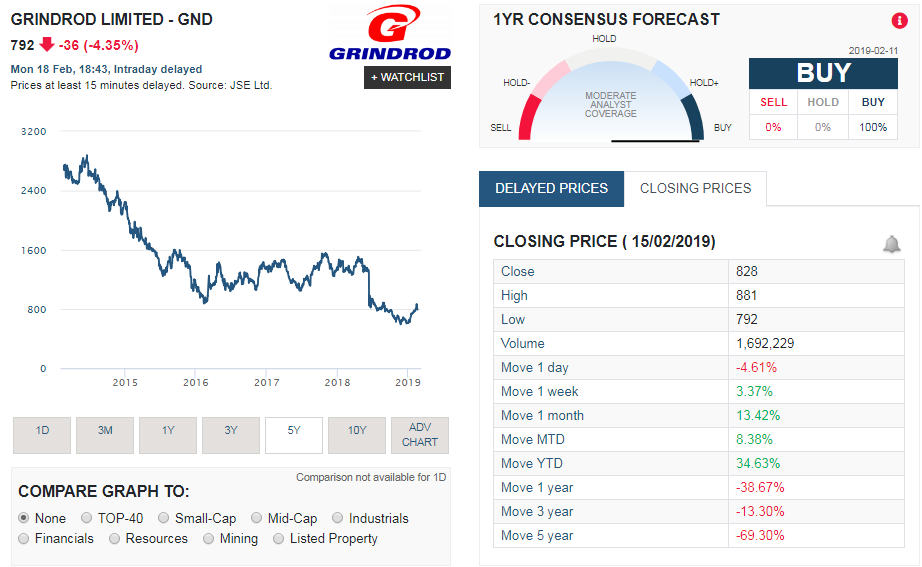
So far this year, the group's shares have gone up by 34.7%, but over the last year it is still down by -38.7% , and over the last 5 years, the company's share price is still down -69.3%. Clearly not happy reading over the long term but it seems to have gathered a bit of short term momentum. Perhaps the trading statement and pending financial results will give it a further nudge to the upside.