|
Related Topics |
|
We take a look at the interim results for the period ending end of August 2018 of Finbond Mutual Bank. Finbond specialises in the design and delivery of unique value- and solution based savings, insurance and transactional banking products.
|
|
About Finbond
Finbond specialises in the design and delivery of unique value- and solutionbased savings, insurance and transactional banking products tailored around depositor and borrower requirements, rather than institutional policies and practices. We focus on our core strength and economic driver that is short-term cash generative lending. We believe we can be the best in the world at short-term unsecured lending, which drives our economic engine. We are deeply passionate about being the best short-term lending company in South Africa.
SHORT-TERM UNSECURED LENDING
Short-term Microcredit Products are offered to the underbanked and underserved market actively seeking credit solutions, but who remain largely unattended and underserviced due to the traditional banks’ concentration on the higher income brackets of the population. Finbond’s Microcredit division currently operates through 252 branches and has 1,159 employees. The remainder of the product range serves Finbond’s ”one thing” concept. Finbond will not launch new ancillary products unless they serve the ”one thing”, are sufficiently profitable and in no way shift the focus of Management away from short-term cash-generative unsecured lending (the ”one thing”).
TRANSACTIONAL BANKING
The Finbond Finsave Light Account, which was launched early in 2016, actively encourages customers to save by paying higher interest on low balances. The Finbond Finsave Light Account is one of the cheapest accounts in South Africa, at only R4 per month. Product rules and features of the Finbond Finsave Light Account include:
• 6% p.a. interest paid on balances up to R20,000, thereafter 4.75%;
• Cash withdrawals at any ATM or cash back at accredited POS devices;
• Free cell phone banking;
• Free internet banking;
• EFT payments and receipts; and
• Debit order functionality.
Transactional banking enhances Finbond’s ”one thing” by improving collections and expanding the product range available to unsecured lending customers
SAVINGS AND INVESTMENTS
Savings and investment products that offer a superior above-average rate of return are offered nationally to investors and pensioners looking for guaranteed higher fixed income in the current environment of depressed yields. Finbond’s strategy is to stimulate savings by offering superior investment and savings solutions, and providing client shareholders with better interest rates, better products and better service. Savings and investment products serve the ”one thing” by providing funding for our short-term unsecured lending products.
The image below shows a breakdown of Finbond's unsecured short-term loan product mix
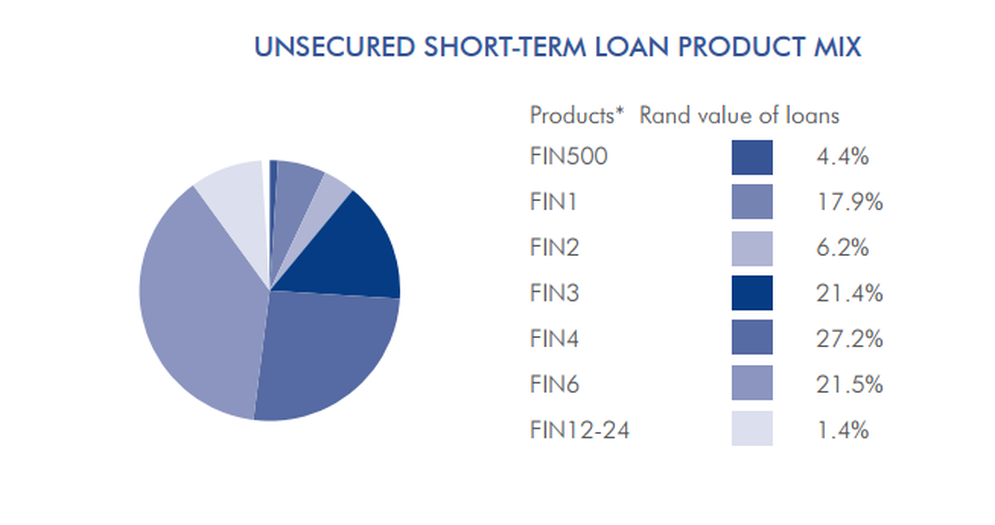
Fin500 refers to cases in which R500 or less has been borrowed. For the rest the number next to Fin refers to the term of the loan granted. So Fin4 shows the percentage of total loans made up by loans whose term is 4 months. So only 1.4% of Finbond's total unsecured loans issued are for loans with a term between 12-24months. Thus the term of unsecured loans issued by Finbond are not very long. The bulk of Finbond's unsecured loans are issued for a term of 4 months, with 4 month term loans making up 27.2% of all unsecured loans issued.
So to the numbers we go
• Finbond Mutual Bank rated 2nd best bank in South Africa and 11th best bank in the world in the Lafferty Global 500 Benchmark Study
• Revenue from continuing operations increased by 12.7% to R1 250.8 million (Aug 2017: R1 110.1 million).
• Operating profit from continuing operations increased by 7.3% to R183.9 million (Aug 2017: R171.4 million).
• Earnings before interest, taxation, depreciation and amortisation (EBITDA) increased by 5.3% to R315.0 million (Aug 2017: R299.2 million).
• Earnings attributable to shareholders of R94.2 million, represented growth of 1.6% over the R92.8 million for the comparative period.
• Overall cash, cash equivalents and liquid investments increased by 29.7% to R772.3 million (Aug 2017: R595.3 million).
• Number of loans advanced remained constant year-on-year at 880,440 (Aug 2017: 880,387) while the value of loans advanced increased by 4.6% to R2 630.3 million (Aug 2017: R2 515.4 million).
• Cash received from customers increased by 10.9% to R3 665.4 million (Aug 2017: R3 304.0 million).
• Branch network increased by 12 branches, to 684 branches, from 28 February 2018.
• USD Revenue contributed 60.1% of Revenue (Aug 2017: 55.9%)
• Cash generated from operations came in at R360 million or 39c per share
• Earnings per share of 10.9c per share (placing them in a PE ratio of 19, which is pretty high, not excessively high but above market average
• No interim dividend declared
For South Africans it is important to note the large chunk of revenue coming in from their US based operations. This provides not only a good Rand hedge opportunity, but also lessens the risk of operating in this segment of the market in South Africa, which is a poorer country than the US and chance of default on loans are a lot greater in South Africa than the USA.
So any comments from management on the results?
The following extracts were taken from their financial results as published earlier today.
"During the period under review, Finbond delivered another set of solid results and made further progress with regards to the realisation of its vision “to be the leading mutual bank in South Africa, improving the quality of life of our clients through their participation in saving together, growing together and ownership of their own community bank”
We remain focused on executing the Group’s five-year strategy and top business priorities; namely continued expansion into North America, optimal capital utilisation, earnings growth, conservative risk management, strict upfront credit scoring, good quality sales, effective collections, cost containment, diversifying bank product ranges, diversifying income streams to USD, consumer education and training, and development of staff members. This enabled us to achieve overall strong operational results despite the current difficult and challenging business environment."
Finbond’s North American business’ main focus is on small short-term unsecured loans being offered through 257 branches in North America operating in the following states: Florida, Ohio, Missouri, Michigan, Mississippi, Alabama, South Carolina, Illinois, Indiana, Wisconsin, California, Oklahoma, Tennessee, Nevada, New Mexico, Utah and Louisiana. In addition to the US states, Finbond also has a presence in Ontario, Canada. Additionally, small unsecured instalment loans are offered online in Illinois, Missouri, Nevada, New Mexico, Utah and Wisconsin through CreditBox, our online platform.
We are currently pursuing licensing in Tennessee and Florida and have plans to expand to up to 10 additional states within the next 24 months. First strike collection rates in North America remained at an impressive average rate of 96%, indicative again of Finbond’s conservative credit granting and rigorous underwriting policies. Total segment revenue from Finbond’s North American short-term lending activities, made up of interest and fees increased by 21% to R751.1 million (Aug 2017: R620.7 million) for the period under review. The short-term loan book ended the six month period at R701.3 million, 24.3% up from 31 August 2017 of R564.3 million). For the period ended 31 August 2018 Finbond’s average North American loan size was up by 1.7% to $352 (Aug 2017: $346) at an average term of 6.2 months (Aug 2017: 6.1 months).
Overall impairment provisions increased by 22.1% to R1 454.6 million (Feb 2018: R1 191.1 million) compared to gross loans and advances growth of 15.1% to R2 688.5 million (Feb 2018: R2 335.5 million) during the year. The lower growth in gross loans and advances in comparison is predominantly due to maintaining a strict credit granting strategy during the current reporting period whilst applying a prudent provisioning methodology.
Strategic initiatives underway include: - Converting Finbond’s mutual banking license to a commercial banking license;
- Application for a banking license in Malta;
- Expansion of the South African branch network in high growth areas;
- Acquiring a further 40 to 60 branches in the United States of America;
- Growing US dollar earnings of the group to approximately 70% to 80% of net earnings.
The challenging and difficult macro-economic environment as well as the adverse market conditions in the South African market within which Finbond operates are not expected to abate in the short and medium-term.
FUTURE PROSPECTS
We remain positive about the Group’s prospects for the future due to: Finbond’s solid earnings and profitability despite difficult market conditions, improvement achieved in cash generated from operating activities, significant percentage of revenue now earned in USD (diversification), management expertise, strong cash flow, strong liquidity and surplus cash position, uniquely positioned 427 branch network in South Africa and 257 branches network in North America (with a number of branches in the process of being acquired), superior asset quality, access to funding, conservative risk management and growth potential. We believe that our continued growth in South Africa, the expansion into the North American short- term lending market and the implementation of our strategic action plan will ensure that we achieve results in the medium and long-term. References to future financial performance included anywhere in this announcement have not been reviewed or reported on by the Group’s external auditors.
So should you buy their shares?
We are worried about the increase in the impairment provisions. Basically the group has stated it is planning on writing off debt issued to clients close to R1.5billion. Cash generated from operations was pretty strong at nearly 40c per share. With a low dividend yield, relatively high PE ratio, risky market they operate in in South Africa and increased impairment provisions (up 22% from 6 months ago), while loans advanced only increased by 15%. We are worried that tough and tougher economic conditions will continue to hurt Finbond and lead to higher impairments which will affect their future earnings. We would advise against investing in Finbond at this point in time and at their current price point of R4.25