South African Market Insights
  • Home
  • Blog
    • Blog-5Jun2018
    • Blog-18May2018
    • Blog-16May2018
    • Blog-3May2018
    • Blog-2May2018
    • Blog-30Apr2018
    • Blog-26Apr2018
    • Blog-24Apr2018
    • Blog-18Apr2018
    • Blog-17Apr2018
    • Blog-16Apr2018
    • Blog-3Apr2018
    • Blog-22Mar2018
    • Blog-20Mar2018
    • Blog-19Mar2018
    • Blog-23Oct2017
    • Blog-20Oct2017
    • Blog-11Oct2017
    • Blog-10Oct2017
    • Blog-6Oct2017
    • Blog-3Oct2017
    • Blog-2Oct2017
  • Economics
    • Rand Dollar Exchange Rate
    • South Africa's GDP
    • South Africa's Unemployment
    • SA by numbers
    • Economic Progress Index
    • Taylors Rule
    • South Africa's Formal Business Sector
    • South-Africa's-Fiscal-Policy
    • SA EU Trade Data
    • Inflation Heat Map
    • Population Density Map
    • Labour Market Dynamics
    • Estimating the Size of the Informal Economy
    • SA Consumer Spending Patterns
    • South Africa's Monetary Fiscal Policy Mix
    • GDP Animations >
      • SouthAfrica
      • WesternCape
      • EasternCape
      • NorthernCape
      • FreeState
      • KwaZuluNatal
      • NorthWest
      • Gauteng
      • Mpumalanga
      • Limpopo
    • South Africa's Economic Structure
    • South Africa's Economic History
    • South Africa's Trade Data Page
    • South Africa's Food and Beverages Sector
    • Financial Well-being of South African Companies_2015
    • SA vs the World
    • Budget Day Page (24 Feb 2016)
  • Stock in Focus
    • JSE ALSI Chart
    • Sector Comparison Page
    • JSE-Calendar-Tracker-2019
    • Adcorp (ADR)
    • Amazon (AMZN)
    • Apple (AAPL)
    • Ascendis (ASC)
    • AVI (AVI)
    • Bidvest (BVT)
    • Blue Label Telecoms (BLU)
    • Bowler Metcalf (BCF)
    • Capitec (CPI)
    • City Lodge Hotel Group
    • Clicks Group (CLS)
    • Coronation (CML)
    • Curro Holdings (COH)
    • Discovery (DSY)
    • Distell (DST)
    • EOH (EOH)
    • Famous Brands (FBR)
    • Ferrari (RACE)
    • FirstRand Group (FSR)
    • Grindrod (GND)
    • GrowthPoint (GRT)
    • Holdsport (HSP)
    • Harley-Davidson (HOG)
    • Hyprop (HYP)
    • Hyprop (HYP)_1Jun2016
    • Investec Property Fund (IPF)
    • JSE (JSE)
    • Massmart (MSM)
    • MediClinic (MEI)
    • MTN (MTN)
    • MTN (MTN)_May2016
    • Mr Price Group (MRP)
    • Mr Price Group (MRP)_8APR2016
    • Nedbank (NED)
    • OneLogix (OLG)
    • Peregrine Holdings (PGR)
    • Pick 'n Pay Stores (PIK)
    • Pioneer Foods (PFG)
    • PSG Group (PSG)
    • Quantum Foods (QFH)
    • RCL Foods (RCL)
    • Remgro (REM)
    • Richemont (CFR)
    • RMB Holdings (RMH)
    • Rolfes (RLF)
    • Sanlam (SLM)
    • Sasol (SOL)
    • Sasol (SOL)_18sep2016
    • Santova (SNV)
    • Spar Group (SPP)
    • Shoprite Holdings (SHP)
    • Spur Corporation (SUR)_7Sep2017
    • Standard Bank (SBK)
    • Steinhoff International Holdings (SNH)
    • Stor-Age (SSS)
    • Super Group (SPG)
    • Taste Holdings (TAS)_30May2016
    • The Foshini Group (TFG)
    • Value Logistics (VLE)
    • Vodacom (VOD)
    • Wilson Bayly Holmes Ovcon (WBO)
    • Woolworths (WHL)
    • Woolworths (WHL)_24Aug2017
    • Zeder (ZED)
  • Online Calculators
    • Rand Petrol Price Estimator
    • Share Valuation
    • Financial Ratios Calculator
    • GDP Growth Estimator
    • Future Value of Investment Calculator
    • Loan repayment calculator
  • Contact
  • About
  • Search

< South Africa's GDP
Economics Main Page >

Coronation is heading ever lower 5 February 2019

​​​Date: 5 February 2019
Category: Stock Market
​Share price: R40.03

Related Topics

We take a look at our technical analysis chart for Coronation, and based on the Fibonacci Fan it looks like Coronation is heading to under R40 a share with possible support around the R37 a share mark
Picture
  • JSE All Share Sunburts chart
  • ​JSE All share pie chart

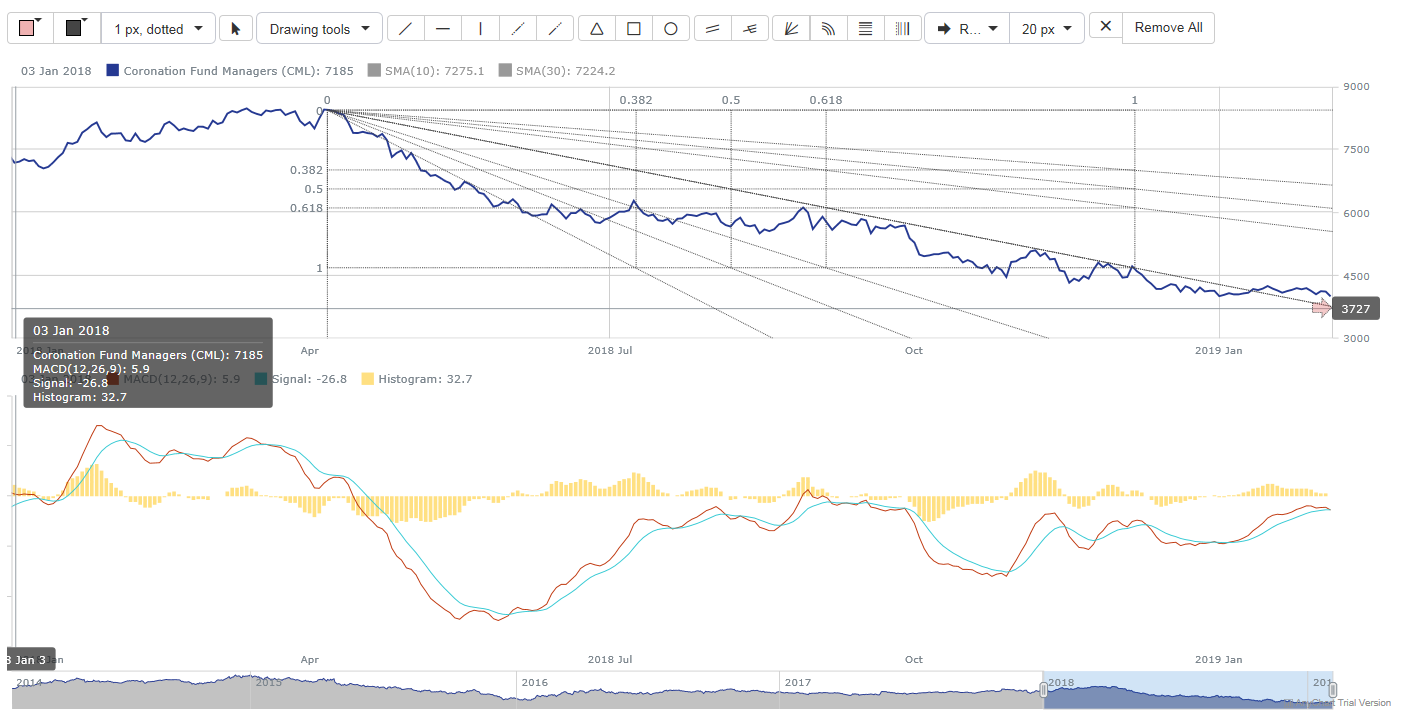
Technical analysis chart for Coronation

While we are fundamentalists at hart and prefer to look at the underlying fundamentals of a company we are not blind to the use of technical analysis in the stock market and value its use for determining buy and sell signals as well as potential support or resistance levels. And because of this we have started to develop new technical analysis charts for various shares so that readers can play around with these graphics and technical indicators too.

Below a technical analysis chart for Coronation (CML)

Fibonacci fan and what it says about CML's share price 

We do enjoy looking at the results of a Fibonacci fan. As the image below shows, taking the starting position as the high reached for Coronation during 2018, and dragging the fan out to the last peak for the end of 2018, we see that the one of the fan lines has been a resistance level for CML on a number of occasions and it is showing that there is potential support should CML continue to drop around the R37.27 per share line.

And all bets are on for CML falling below R40 a share as the MACD (moving average convergence divergence) shows a bearish signal, with the MACD line looking to cross below the signal line (see the bottom graphic in which the red MACD line is looking to cross below the blue signal line which is a bearish indicator for the share price).

Picture
Fundamentally we love CML and believe at its current PE ratio and massive dividend yield the market is punishing them far to hard. And the reasoning behind this is the fact that poor stock market performance means less chance of CML beating the benchmarks which in turn leads to lower performance fees charged. The group is looking to lessen its dependence on performance fees and make more money from annuity fees, such as the annual management fee charged. Other fund managers such as Peregrine is looking to do the same, and has perhaps been more succesful in the recent past in doing so. See more about CML's and Peregrine (PGR) latest financials by clicking on their hyperlinked names.

Newsletter Subscription:

    Please enter your email address below to subscribe to our newsletter. It will be ad hoc newsletters and we wont bombard your email inbox with emails. We will NEVER supply your contact details to any third party.

Subscribe to Newsletter

Additional content

Related Topics

  • JSE All Share Sunburts chart
  • ​JSE All share pie chart​


​Homepage

Economics Page
Stock in Focus Page


​About


Contact Us

Copyright © 2015
  • Home
  • Blog
    • Blog-5Jun2018
    • Blog-18May2018
    • Blog-16May2018
    • Blog-3May2018
    • Blog-2May2018
    • Blog-30Apr2018
    • Blog-26Apr2018
    • Blog-24Apr2018
    • Blog-18Apr2018
    • Blog-17Apr2018
    • Blog-16Apr2018
    • Blog-3Apr2018
    • Blog-22Mar2018
    • Blog-20Mar2018
    • Blog-19Mar2018
    • Blog-23Oct2017
    • Blog-20Oct2017
    • Blog-11Oct2017
    • Blog-10Oct2017
    • Blog-6Oct2017
    • Blog-3Oct2017
    • Blog-2Oct2017
  • Economics
    • Rand Dollar Exchange Rate
    • South Africa's GDP
    • South Africa's Unemployment
    • SA by numbers
    • Economic Progress Index
    • Taylors Rule
    • South Africa's Formal Business Sector
    • South-Africa's-Fiscal-Policy
    • SA EU Trade Data
    • Inflation Heat Map
    • Population Density Map
    • Labour Market Dynamics
    • Estimating the Size of the Informal Economy
    • SA Consumer Spending Patterns
    • South Africa's Monetary Fiscal Policy Mix
    • GDP Animations >
      • SouthAfrica
      • WesternCape
      • EasternCape
      • NorthernCape
      • FreeState
      • KwaZuluNatal
      • NorthWest
      • Gauteng
      • Mpumalanga
      • Limpopo
    • South Africa's Economic Structure
    • South Africa's Economic History
    • South Africa's Trade Data Page
    • South Africa's Food and Beverages Sector
    • Financial Well-being of South African Companies_2015
    • SA vs the World
    • Budget Day Page (24 Feb 2016)
  • Stock in Focus
    • JSE ALSI Chart
    • Sector Comparison Page
    • JSE-Calendar-Tracker-2019
    • Adcorp (ADR)
    • Amazon (AMZN)
    • Apple (AAPL)
    • Ascendis (ASC)
    • AVI (AVI)
    • Bidvest (BVT)
    • Blue Label Telecoms (BLU)
    • Bowler Metcalf (BCF)
    • Capitec (CPI)
    • City Lodge Hotel Group
    • Clicks Group (CLS)
    • Coronation (CML)
    • Curro Holdings (COH)
    • Discovery (DSY)
    • Distell (DST)
    • EOH (EOH)
    • Famous Brands (FBR)
    • Ferrari (RACE)
    • FirstRand Group (FSR)
    • Grindrod (GND)
    • GrowthPoint (GRT)
    • Holdsport (HSP)
    • Harley-Davidson (HOG)
    • Hyprop (HYP)
    • Hyprop (HYP)_1Jun2016
    • Investec Property Fund (IPF)
    • JSE (JSE)
    • Massmart (MSM)
    • MediClinic (MEI)
    • MTN (MTN)
    • MTN (MTN)_May2016
    • Mr Price Group (MRP)
    • Mr Price Group (MRP)_8APR2016
    • Nedbank (NED)
    • OneLogix (OLG)
    • Peregrine Holdings (PGR)
    • Pick 'n Pay Stores (PIK)
    • Pioneer Foods (PFG)
    • PSG Group (PSG)
    • Quantum Foods (QFH)
    • RCL Foods (RCL)
    • Remgro (REM)
    • Richemont (CFR)
    • RMB Holdings (RMH)
    • Rolfes (RLF)
    • Sanlam (SLM)
    • Sasol (SOL)
    • Sasol (SOL)_18sep2016
    • Santova (SNV)
    • Spar Group (SPP)
    • Shoprite Holdings (SHP)
    • Spur Corporation (SUR)_7Sep2017
    • Standard Bank (SBK)
    • Steinhoff International Holdings (SNH)
    • Stor-Age (SSS)
    • Super Group (SPG)
    • Taste Holdings (TAS)_30May2016
    • The Foshini Group (TFG)
    • Value Logistics (VLE)
    • Vodacom (VOD)
    • Wilson Bayly Holmes Ovcon (WBO)
    • Woolworths (WHL)
    • Woolworths (WHL)_24Aug2017
    • Zeder (ZED)
  • Online Calculators
    • Rand Petrol Price Estimator
    • Share Valuation
    • Financial Ratios Calculator
    • GDP Growth Estimator
    • Future Value of Investment Calculator
    • Loan repayment calculator
  • Contact
  • About
  • Search