|
Related Topics |
|
In today's blog we take a look at the South Africa's manufacturing of agricultural related products based on indices of volumes produced as published by Statistics South Africa.
Has manufacturing of these items grown over the years as South Africa's population has grown? We take a look below |

Capitec blowing the JSE Financial Index away
|
The numbers.. What is it saying about SA's manufacturing and production of agri related goods?
We will take a look at the production of agricultural goods for the following main groupings:
Note we are looking at index levels of physical goods produced in South Africa. Thus quantities and kilograms and tons of goods produced are indexed by Stats SA to 2015=100. We reindexed the numbers to January 2000=100. Thus we will show movement in the production of the goods above from the start of 2000 to the latest data point available. Has the number of units being produced increased over time or not?
Note we are looking at index levels of physical goods produced in South Africa. Thus quantities and kilograms and tons of goods produced are indexed by Stats SA to 2015=100. We reindexed the numbers to January 2000=100. Thus we will show movement in the production of the goods above from the start of 2000 to the latest data point available. Has the number of units being produced increased over time or not?
While we will take a look at the growth rates from January 2000 to the latest data point, we will also take a look at the year on year movements of the goods mentioned above.
Growth from January 2000 to December 2017
As can be seen from the graphic above, the growth in the various groups have been rather subdued over the years, and even though the population has been increasing steadily over the years, the production of agricultural related products in South Africa has remained relatively flat. Pointing to one of two things.
1. People in South Africa are consuming less of these items
2. More and more of these goods are being imported.
1. People in South Africa are consuming less of these items
2. More and more of these goods are being imported.
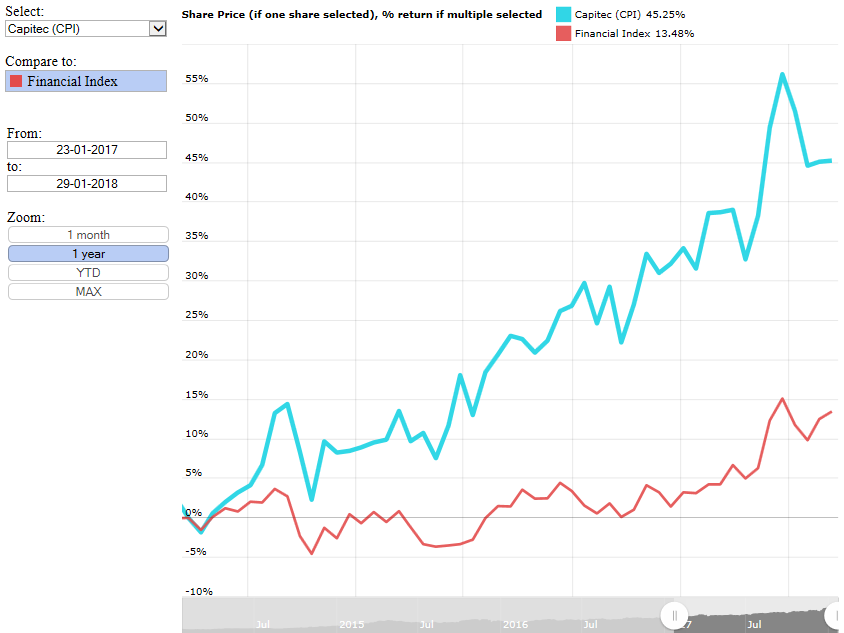
Last 12 months |
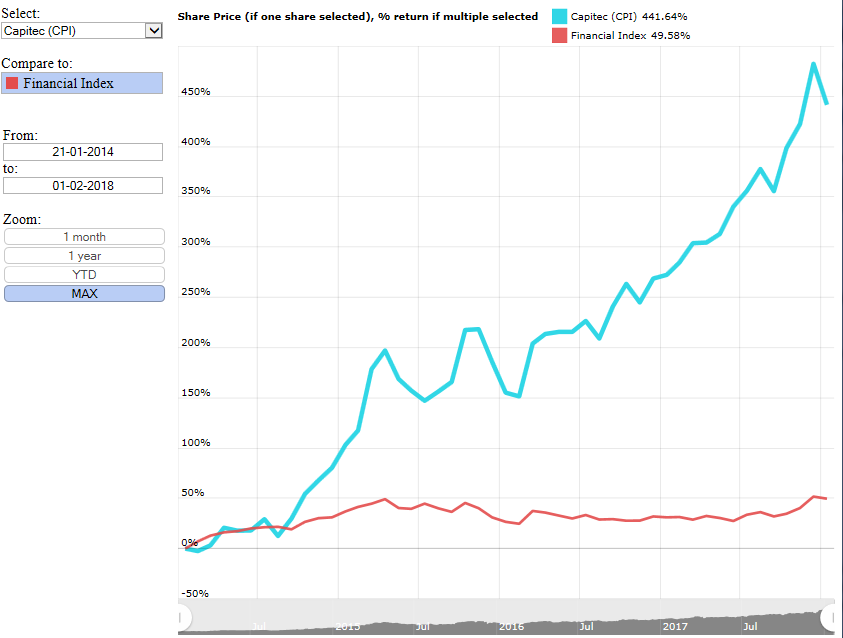
Last 4 years |
|
|
As the two images above show, Capitec's share price performance over the last 12month and last 4 years are far superior to the returns delivered by the financial index of the JSE. Just showing by how much Capitec's share price has outperformed that of its listed peers.
In the last 12months Capitec's share price is up by 45.25% while the financial index only returned 13.48% (Capitec outperforming it by 3 times).
In the last 4 years, Capitec has shown extraordinary growth of 441.64% compare to the financial index's 49.6% return over the same period. The return of Capitec compared to the Financial index is 8.9 times more over the last 4 years. While growth in Capitec's share price is expected to slow over time as their rapid growth starts to ease, it sure has been a brilliant performer over the years and has made its shareholders (including big shareholder PSG Group) exceptional returns.
Interactive Capitec and Financial Index graphic
As users change the dates the graphic will automatically recalculate the return of both Capitec and the financial index of the JSE. We encourage users to play around with the graph. The scroll bar at the bottom of the graphic can be used to select the dates readers would like too.
From the above graphic it is pretty clear that the PE ratio is far greater than the cash generated per share ratio. This is due to the fact that cash generated per share is far higher than actual earnings per share. As earnings reported includes all operating expenses and taxes paid, while cash generated by operations just focuses on the cash generation ability of a company.
For OLG for example, while their reported earnings came in at 29.6c a share, they generated a very healthy R1.20 in cash per share. And with a share price of just R3.20, its PCGPS ratio is exceptionally low. While Bid Corp's PCGPS ratio is far higher than that of OLG, with it sitting at closer to 15.. Thus the cash generated by Bid Corp per share amounts to roughly 6.8% of Bid Corp's share price, whereas for OLG this was sitting 37.5%
Does the CGPS provide a magic pill in determining whether a share is undervalued or not? Absolutely not, but it does provide readers with a good indication of just how cash generative a business is (assuming of course they dont cheat and defraud investors with unreliable financial statements as is the case with Steinhoff).
Let us know what you thought of this article: |