South African Market Insights
  • Home
  • Blog
    • Blog-5Jun2018
    • Blog-18May2018
    • Blog-16May2018
    • Blog-3May2018
    • Blog-2May2018
    • Blog-30Apr2018
    • Blog-26Apr2018
    • Blog-24Apr2018
    • Blog-18Apr2018
    • Blog-17Apr2018
    • Blog-16Apr2018
    • Blog-3Apr2018
    • Blog-22Mar2018
    • Blog-20Mar2018
    • Blog-19Mar2018
    • Blog-23Oct2017
    • Blog-20Oct2017
    • Blog-11Oct2017
    • Blog-10Oct2017
    • Blog-6Oct2017
    • Blog-3Oct2017
    • Blog-2Oct2017
  • Economics
    • Rand Dollar Exchange Rate
    • South Africa's GDP
    • South Africa's Unemployment
    • SA by numbers
    • Economic Progress Index
    • Taylors Rule
    • South Africa's Formal Business Sector
    • South-Africa's-Fiscal-Policy
    • SA EU Trade Data
    • Inflation Heat Map
    • Population Density Map
    • Labour Market Dynamics
    • Estimating the Size of the Informal Economy
    • SA Consumer Spending Patterns
    • South Africa's Monetary Fiscal Policy Mix
    • GDP Animations >
      • SouthAfrica
      • WesternCape
      • EasternCape
      • NorthernCape
      • FreeState
      • KwaZuluNatal
      • NorthWest
      • Gauteng
      • Mpumalanga
      • Limpopo
    • South Africa's Economic Structure
    • South Africa's Economic History
    • South Africa's Trade Data Page
    • South Africa's Food and Beverages Sector
    • Financial Well-being of South African Companies_2015
    • SA vs the World
    • Budget Day Page (24 Feb 2016)
  • Stock in Focus
    • JSE ALSI Chart
    • Sector Comparison Page
    • JSE-Calendar-Tracker-2019
    • Adcorp (ADR)
    • Amazon (AMZN)
    • Apple (AAPL)
    • Ascendis (ASC)
    • AVI (AVI)
    • Bidvest (BVT)
    • Blue Label Telecoms (BLU)
    • Bowler Metcalf (BCF)
    • Capitec (CPI)
    • City Lodge Hotel Group
    • Clicks Group (CLS)
    • Coronation (CML)
    • Curro Holdings (COH)
    • Discovery (DSY)
    • Distell (DST)
    • EOH (EOH)
    • Famous Brands (FBR)
    • Ferrari (RACE)
    • FirstRand Group (FSR)
    • Grindrod (GND)
    • GrowthPoint (GRT)
    • Holdsport (HSP)
    • Harley-Davidson (HOG)
    • Hyprop (HYP)
    • Hyprop (HYP)_1Jun2016
    • Investec Property Fund (IPF)
    • JSE (JSE)
    • Massmart (MSM)
    • MediClinic (MEI)
    • MTN (MTN)
    • MTN (MTN)_May2016
    • Mr Price Group (MRP)
    • Mr Price Group (MRP)_8APR2016
    • Nedbank (NED)
    • OneLogix (OLG)
    • Peregrine Holdings (PGR)
    • Pick 'n Pay Stores (PIK)
    • Pioneer Foods (PFG)
    • PSG Group (PSG)
    • Quantum Foods (QFH)
    • RCL Foods (RCL)
    • Remgro (REM)
    • Richemont (CFR)
    • RMB Holdings (RMH)
    • Rolfes (RLF)
    • Sanlam (SLM)
    • Sasol (SOL)
    • Sasol (SOL)_18sep2016
    • Santova (SNV)
    • Spar Group (SPP)
    • Shoprite Holdings (SHP)
    • Spur Corporation (SUR)_7Sep2017
    • Standard Bank (SBK)
    • Steinhoff International Holdings (SNH)
    • Stor-Age (SSS)
    • Super Group (SPG)
    • Taste Holdings (TAS)_30May2016
    • The Foshini Group (TFG)
    • Value Logistics (VLE)
    • Vodacom (VOD)
    • Wilson Bayly Holmes Ovcon (WBO)
    • Woolworths (WHL)
    • Woolworths (WHL)_24Aug2017
    • Zeder (ZED)
  • Online Calculators
    • Rand Petrol Price Estimator
    • Share Valuation
    • Financial Ratios Calculator
    • GDP Growth Estimator
    • Future Value of Investment Calculator
    • Loan repayment calculator
  • Contact
  • About
  • Search

< What the Big Mac index says about the value of the rand
Monetary Fiscal Policy Mix >

South Africa's trade industry looked at in more detail

Category: Trade industry and economics
Date: 2 November 2017 

Related Topics

In today's blog we will take a detailed look at the trade industry in South Africa. Trade includes wholesale trade, retail trade, motor trade, accommodation and the food and beverages industry. And with this industry being largely consumer driven, any weakness in consumer spending will adversely affect the sector.

Please note the source of all images and data on this page is Statistics South Africa. www.statssa.gov.za

Picture
  • ​South Africa's trade data page

So what is the contribution ofthe trade industry to SA's GDP?

The image below shows the share of the various industries to South Africa's nominal GDP in 2016. Nominal implies that the values have not been adjusted for inflation.
Picture
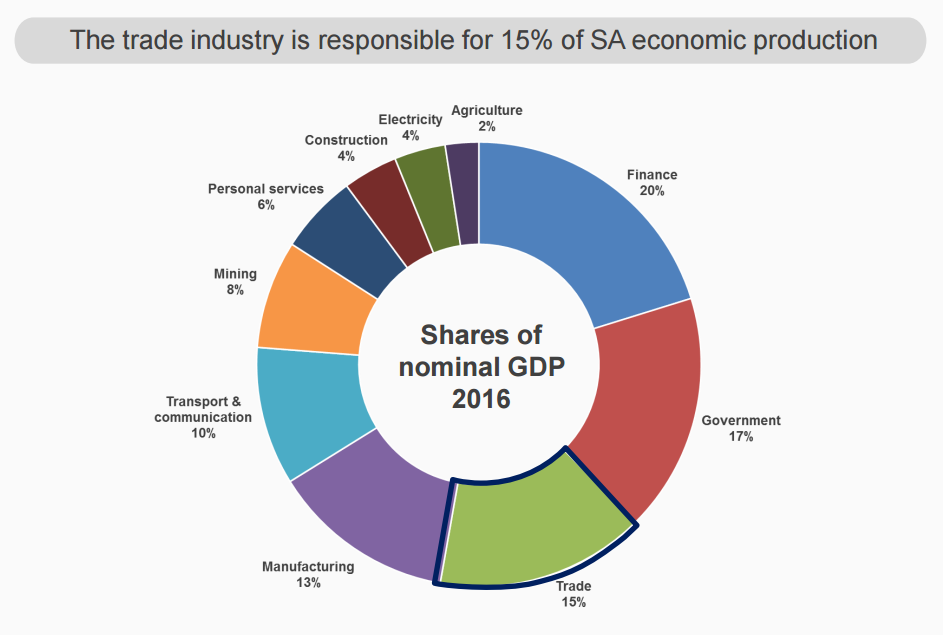
Contribution per industry to South Africa's nominal GDP in 2016
As the image above shows the Trade industry contributed 15% to South Africa's nominal GDP in 2016. That makes the trade industry the third largest industry in South Africa's economy. And its importance has increased over time. See our animated GDP graphic for more. The trade industry has overtaken the manufacturing industry in terms of importance in the South African economy, as the manufacturing industry has shown gradual declines over time, as South Africa imports more and more rather than manufacture locally. 
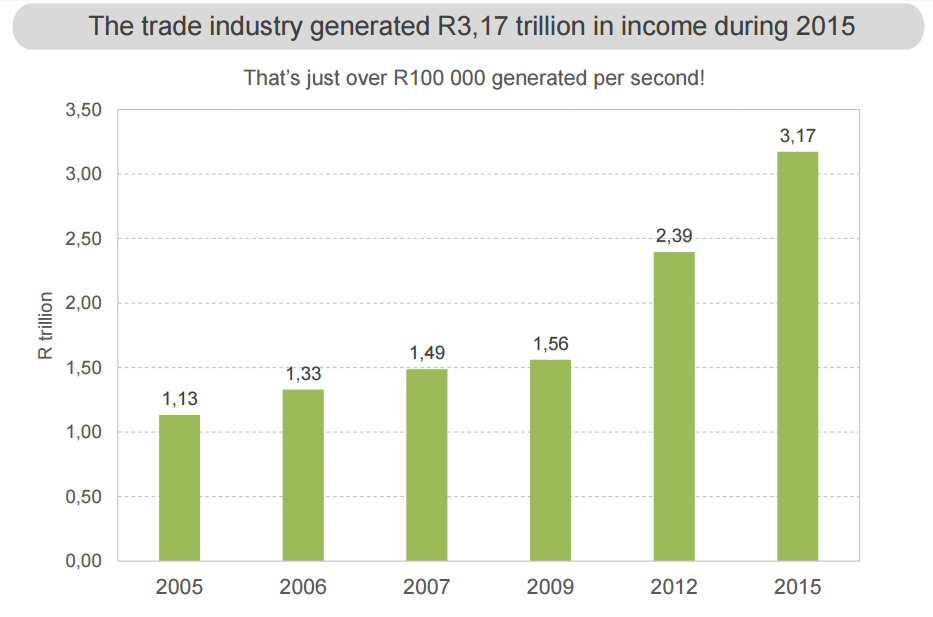
The image below shows the income earned per year by the trade industry as a whole. And it shows the rapid increase in income earned from 2005 to 2015. Income earned from 2005 to 2015 has increased by 180.5%  That is strong growth over the period in question. In 2015 the trade industry generated a whopping R3.17trillion. Almost triple the amount it generated in 2005, while inflation played a part in the growth of the income earned by the industry, there is strong underlying growth in the industry from 2005 to 2015, as more people were employed, urbanisation took place, and easier access to capital via loans. Worrying for this industry and South Africa's economy as whole tho is the fact that a lot of the purchases in this industry is funded with debt.
Picture
Total income earned by trade industry from 2005 to 2015
The image, that was obtained from Statistics South Africa also states that the income generated by the trade industry in South Africa equates to roughly R100 000 a second in South Africa. Now that we know how much is generated and the relative importance of trade within South Africa's economy, which industries within the trade industry generated the most income? The image below answers that question.
Picture
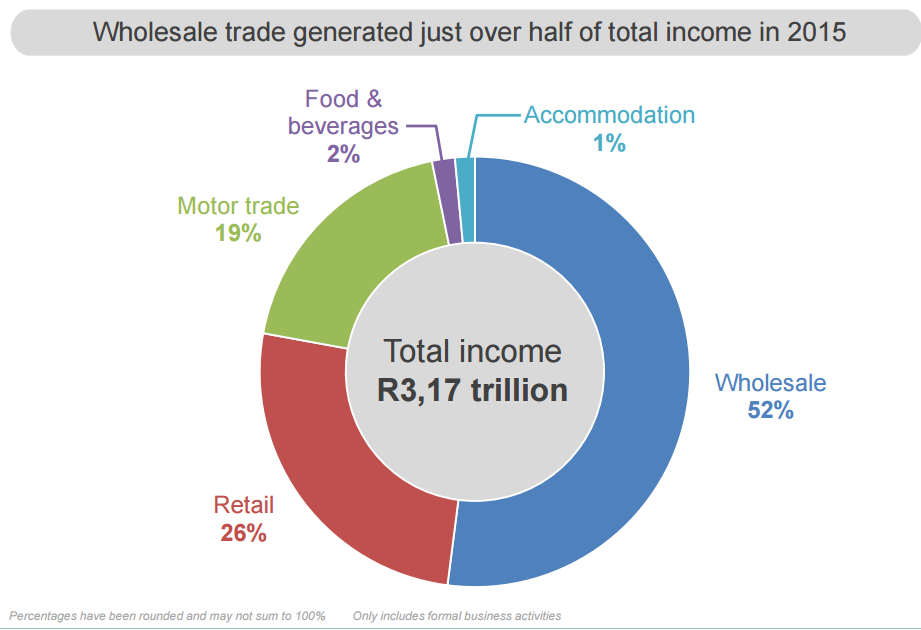
Biggest contributors to income in South Africa's trade industry for 2015
Wholesale trade contributed more than 50% to the total income earned by the trade industry in 2015. With retail coming in a distant 2nd place with 26% of income earned in the trade industry and motor trade coming in in 3rd place with 19% of income earned. The food and beverages and accommodation sectors are dwarfed by the other sectors within trade. While they are small, we have a dedicated page for South Africa's Food and Beverages industry that can be found here: Food and Beverages Sector

The logical next question is what contributes to each industry within trade's income? The cluster of pie charts below answers that question.
Picture
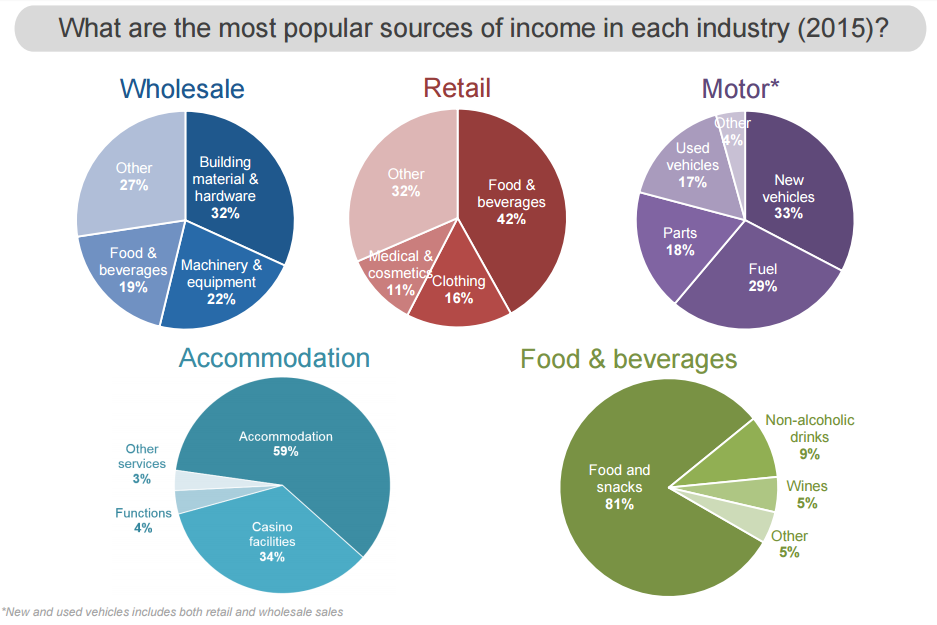
Sources of income per industry within trade in South Africa
Largest contributors to each industry within trade is as follows:
  • Wholesale: Building materials and hardware (32%)
  • Retail: Food and beverages (42%)
  • Motor Trade: New vehicles (33%)
  • Accommodation: Accomodation (59%)
  • Food and beverages: Food and snacks (81%)

Something that is not looked at regularly and that Statistics South Africa has started looking at is the concentration ratios within industries. Concentration ratios shows what percentage of income is earned by a few players in the market. If there are few big companies dominating a market it is said to be monopolistic and off course this hinders competition which in turn can lead to higher prices (as there is not enough competition to start pricing wars which will drag down prices). So what are the concentration ratios like in the various industries within trade? Well Statistics South Africa published the following graphic:
Picture
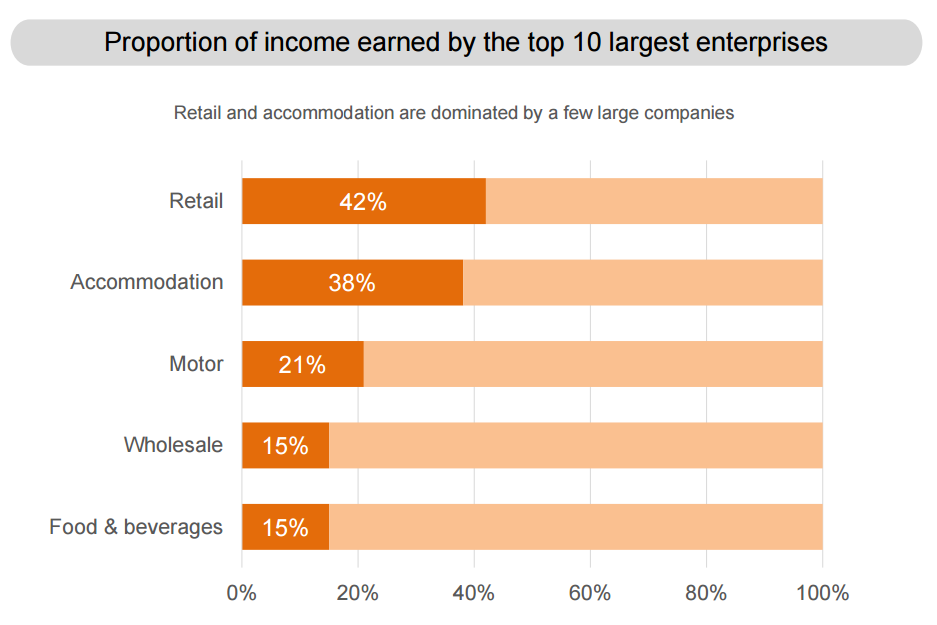
Income earned by 10 largest companies per industry within Trade in South Africa
The ten largest companies in the retail sector brings in 42% of the total income of the retail industry. Think of the likes of Shoprite, Pick 'n Pay, Woolworths etc. And in the accomodation industry the ten largest companies brings in 38% of total income. In this case it would be companies such as City Lodge, Sun International, Protea Hotels etc. While the contribution of a few large firms in the retail and accommodation industries are worrying, it is not alarming. Worrying to consumers, competition commission etc would be if income earned by a few is well above 50%, or of the measured ratios above gets worse over time. Then it is clear that the smaller firms might need help via certain laws or policies.

Let us know what you thought of this article:


Additional content:

Related Topics

  • South Africa's Trade Data Page​


​Homepage

Economics Page
Stock in Focus Page


​About


Contact Us

Copyright © 2015
  • Home
  • Blog
    • Blog-5Jun2018
    • Blog-18May2018
    • Blog-16May2018
    • Blog-3May2018
    • Blog-2May2018
    • Blog-30Apr2018
    • Blog-26Apr2018
    • Blog-24Apr2018
    • Blog-18Apr2018
    • Blog-17Apr2018
    • Blog-16Apr2018
    • Blog-3Apr2018
    • Blog-22Mar2018
    • Blog-20Mar2018
    • Blog-19Mar2018
    • Blog-23Oct2017
    • Blog-20Oct2017
    • Blog-11Oct2017
    • Blog-10Oct2017
    • Blog-6Oct2017
    • Blog-3Oct2017
    • Blog-2Oct2017
  • Economics
    • Rand Dollar Exchange Rate
    • South Africa's GDP
    • South Africa's Unemployment
    • SA by numbers
    • Economic Progress Index
    • Taylors Rule
    • South Africa's Formal Business Sector
    • South-Africa's-Fiscal-Policy
    • SA EU Trade Data
    • Inflation Heat Map
    • Population Density Map
    • Labour Market Dynamics
    • Estimating the Size of the Informal Economy
    • SA Consumer Spending Patterns
    • South Africa's Monetary Fiscal Policy Mix
    • GDP Animations >
      • SouthAfrica
      • WesternCape
      • EasternCape
      • NorthernCape
      • FreeState
      • KwaZuluNatal
      • NorthWest
      • Gauteng
      • Mpumalanga
      • Limpopo
    • South Africa's Economic Structure
    • South Africa's Economic History
    • South Africa's Trade Data Page
    • South Africa's Food and Beverages Sector
    • Financial Well-being of South African Companies_2015
    • SA vs the World
    • Budget Day Page (24 Feb 2016)
  • Stock in Focus
    • JSE ALSI Chart
    • Sector Comparison Page
    • JSE-Calendar-Tracker-2019
    • Adcorp (ADR)
    • Amazon (AMZN)
    • Apple (AAPL)
    • Ascendis (ASC)
    • AVI (AVI)
    • Bidvest (BVT)
    • Blue Label Telecoms (BLU)
    • Bowler Metcalf (BCF)
    • Capitec (CPI)
    • City Lodge Hotel Group
    • Clicks Group (CLS)
    • Coronation (CML)
    • Curro Holdings (COH)
    • Discovery (DSY)
    • Distell (DST)
    • EOH (EOH)
    • Famous Brands (FBR)
    • Ferrari (RACE)
    • FirstRand Group (FSR)
    • Grindrod (GND)
    • GrowthPoint (GRT)
    • Holdsport (HSP)
    • Harley-Davidson (HOG)
    • Hyprop (HYP)
    • Hyprop (HYP)_1Jun2016
    • Investec Property Fund (IPF)
    • JSE (JSE)
    • Massmart (MSM)
    • MediClinic (MEI)
    • MTN (MTN)
    • MTN (MTN)_May2016
    • Mr Price Group (MRP)
    • Mr Price Group (MRP)_8APR2016
    • Nedbank (NED)
    • OneLogix (OLG)
    • Peregrine Holdings (PGR)
    • Pick 'n Pay Stores (PIK)
    • Pioneer Foods (PFG)
    • PSG Group (PSG)
    • Quantum Foods (QFH)
    • RCL Foods (RCL)
    • Remgro (REM)
    • Richemont (CFR)
    • RMB Holdings (RMH)
    • Rolfes (RLF)
    • Sanlam (SLM)
    • Sasol (SOL)
    • Sasol (SOL)_18sep2016
    • Santova (SNV)
    • Spar Group (SPP)
    • Shoprite Holdings (SHP)
    • Spur Corporation (SUR)_7Sep2017
    • Standard Bank (SBK)
    • Steinhoff International Holdings (SNH)
    • Stor-Age (SSS)
    • Super Group (SPG)
    • Taste Holdings (TAS)_30May2016
    • The Foshini Group (TFG)
    • Value Logistics (VLE)
    • Vodacom (VOD)
    • Wilson Bayly Holmes Ovcon (WBO)
    • Woolworths (WHL)
    • Woolworths (WHL)_24Aug2017
    • Zeder (ZED)
  • Online Calculators
    • Rand Petrol Price Estimator
    • Share Valuation
    • Financial Ratios Calculator
    • GDP Growth Estimator
    • Future Value of Investment Calculator
    • Loan repayment calculator
  • Contact
  • About
  • Search