South African Market Insights
  • Home
  • Blog
    • Blog-5Jun2018
    • Blog-18May2018
    • Blog-16May2018
    • Blog-3May2018
    • Blog-2May2018
    • Blog-30Apr2018
    • Blog-26Apr2018
    • Blog-24Apr2018
    • Blog-18Apr2018
    • Blog-17Apr2018
    • Blog-16Apr2018
    • Blog-3Apr2018
    • Blog-22Mar2018
    • Blog-20Mar2018
    • Blog-19Mar2018
    • Blog-23Oct2017
    • Blog-20Oct2017
    • Blog-11Oct2017
    • Blog-10Oct2017
    • Blog-6Oct2017
    • Blog-3Oct2017
    • Blog-2Oct2017
  • Economics
    • Rand Dollar Exchange Rate
    • South Africa's GDP
    • South Africa's Unemployment
    • SA by numbers
    • Economic Progress Index
    • Taylors Rule
    • South Africa's Formal Business Sector
    • South-Africa's-Fiscal-Policy
    • SA EU Trade Data
    • Inflation Heat Map
    • Population Density Map
    • Labour Market Dynamics
    • Estimating the Size of the Informal Economy
    • SA Consumer Spending Patterns
    • South Africa's Monetary Fiscal Policy Mix
    • GDP Animations >
      • SouthAfrica
      • WesternCape
      • EasternCape
      • NorthernCape
      • FreeState
      • KwaZuluNatal
      • NorthWest
      • Gauteng
      • Mpumalanga
      • Limpopo
    • South Africa's Economic Structure
    • South Africa's Economic History
    • South Africa's Trade Data Page
    • South Africa's Food and Beverages Sector
    • Financial Well-being of South African Companies_2015
    • SA vs the World
    • Budget Day Page (24 Feb 2016)
  • Stock in Focus
    • JSE ALSI Chart
    • Sector Comparison Page
    • JSE-Calendar-Tracker-2019
    • Adcorp (ADR)
    • Amazon (AMZN)
    • Apple (AAPL)
    • Ascendis (ASC)
    • AVI (AVI)
    • Bidvest (BVT)
    • Blue Label Telecoms (BLU)
    • Bowler Metcalf (BCF)
    • Capitec (CPI)
    • City Lodge Hotel Group
    • Clicks Group (CLS)
    • Coronation (CML)
    • Curro Holdings (COH)
    • Discovery (DSY)
    • Distell (DST)
    • EOH (EOH)
    • Famous Brands (FBR)
    • Ferrari (RACE)
    • FirstRand Group (FSR)
    • Grindrod (GND)
    • GrowthPoint (GRT)
    • Holdsport (HSP)
    • Harley-Davidson (HOG)
    • Hyprop (HYP)
    • Hyprop (HYP)_1Jun2016
    • Investec Property Fund (IPF)
    • JSE (JSE)
    • Massmart (MSM)
    • MediClinic (MEI)
    • MTN (MTN)
    • MTN (MTN)_May2016
    • Mr Price Group (MRP)
    • Mr Price Group (MRP)_8APR2016
    • Nedbank (NED)
    • OneLogix (OLG)
    • Peregrine Holdings (PGR)
    • Pick 'n Pay Stores (PIK)
    • Pioneer Foods (PFG)
    • PSG Group (PSG)
    • Quantum Foods (QFH)
    • RCL Foods (RCL)
    • Remgro (REM)
    • Richemont (CFR)
    • RMB Holdings (RMH)
    • Rolfes (RLF)
    • Sanlam (SLM)
    • Sasol (SOL)
    • Sasol (SOL)_18sep2016
    • Santova (SNV)
    • Spar Group (SPP)
    • Shoprite Holdings (SHP)
    • Spur Corporation (SUR)_7Sep2017
    • Standard Bank (SBK)
    • Steinhoff International Holdings (SNH)
    • Stor-Age (SSS)
    • Super Group (SPG)
    • Taste Holdings (TAS)_30May2016
    • The Foshini Group (TFG)
    • Value Logistics (VLE)
    • Vodacom (VOD)
    • Wilson Bayly Holmes Ovcon (WBO)
    • Woolworths (WHL)
    • Woolworths (WHL)_24Aug2017
    • Zeder (ZED)
  • Online Calculators
    • Rand Petrol Price Estimator
    • Share Valuation
    • Financial Ratios Calculator
    • GDP Growth Estimator
    • Future Value of Investment Calculator
    • Loan repayment calculator
  • Contact
  • About
  • Search

< What the Big Mac index says about the value of the rand
Monetary Fiscal Policy Mix >

South Africa's Woolworths (WHL) compared to a few international "department stores"

Category: Financial markets and Woolworths (WHL)
​Date
: 2 March 2018

Related Topics

In today's blog we take a look at South Africa's Woolworths share price over the last 5 years and compare it to the price movements of a few well known international department stores such as Belk, Sears and Nordstrom. 

Just how well is Woolworths performing compared to these department store giants? We take a look below

Picture
  • SA vs The World
  • ​Sector Comparison Page
  • ​Inflation Heat Map
  • Spending Patterns of consumers

Woolies wants world domination, but not with this share price performance

 Woolworths has made significant strides in the last 20 years in becoming one of South Africa's biggest retail chains with them selling clothes, home ware as well as excellent food. So they decided to branch out and buy a few brands in Australia such as David Jones. But all has not gone swimmingly in Australia with Woolies even admitting they paid to much for their Aussie brands David Jones and Country Road. And the market has punished the share price, and rightly so, but the question is whether Woolies as probably SA's prime "department store" been the only department store that has taken a knock over the last number of years? 

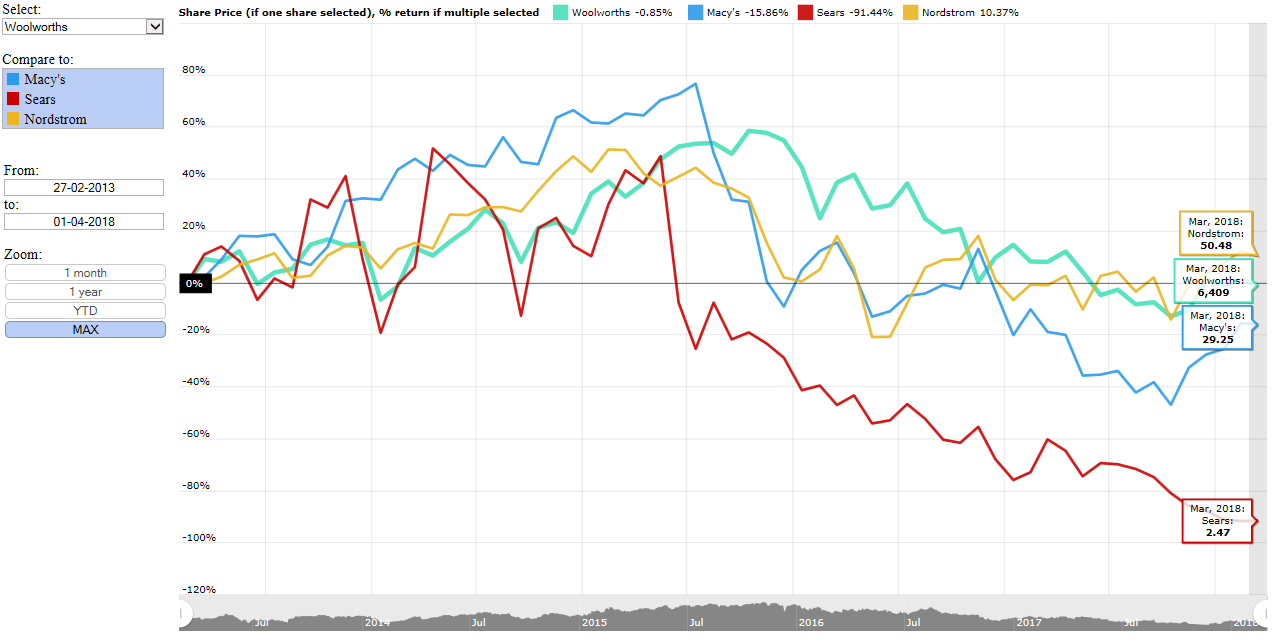
Well we set out to investigate and decided to compare Woolworths share price over the lat 5 years with that of Macy's, Nordstrom and Sears. The graphic below shows the share price of Woolies, as readers click on the name of the other department stores, the graphic shows the share price return of the date chosen by the user. Users can select, 1month, Year to Date (YTD), MAX which in this case is 5 years, or readers can input the dates they want to look at. Note the data for Woolworths was obtained from PSG while the data for the foreign shares were obtained from Macrotrends.net
As the graphic shows, Woolies is not the only one that has taken a beating recently. Investors in Woolies can be very happy that they are not investors in Sears for example. The image below shows the MAX (last 5 years return) for all the above mentioned department stores. And as the graphic shows Sears has lost 91% of its value over 5 years, Woolworths only down 0.85%, Macy's down 15.9% and Nordstrom the only one showing a positive return over the last 5 years with it edging out a return of just 10.4% over the last 5 years.

5 Year return

Picture
While investor returns for woolies over the last 2 years have been extremely poor, as the image below shows, again of the 4 department stores looked at Woolies is the 2nd best performer in terms of share price movements. While this is no consolation for the extremely poor returns suffered by Woolies shareholder it does put it into perspective that things could have been a lot worse for investors if they rather invested in more famous brands such as Sears or Macy's.
Picture
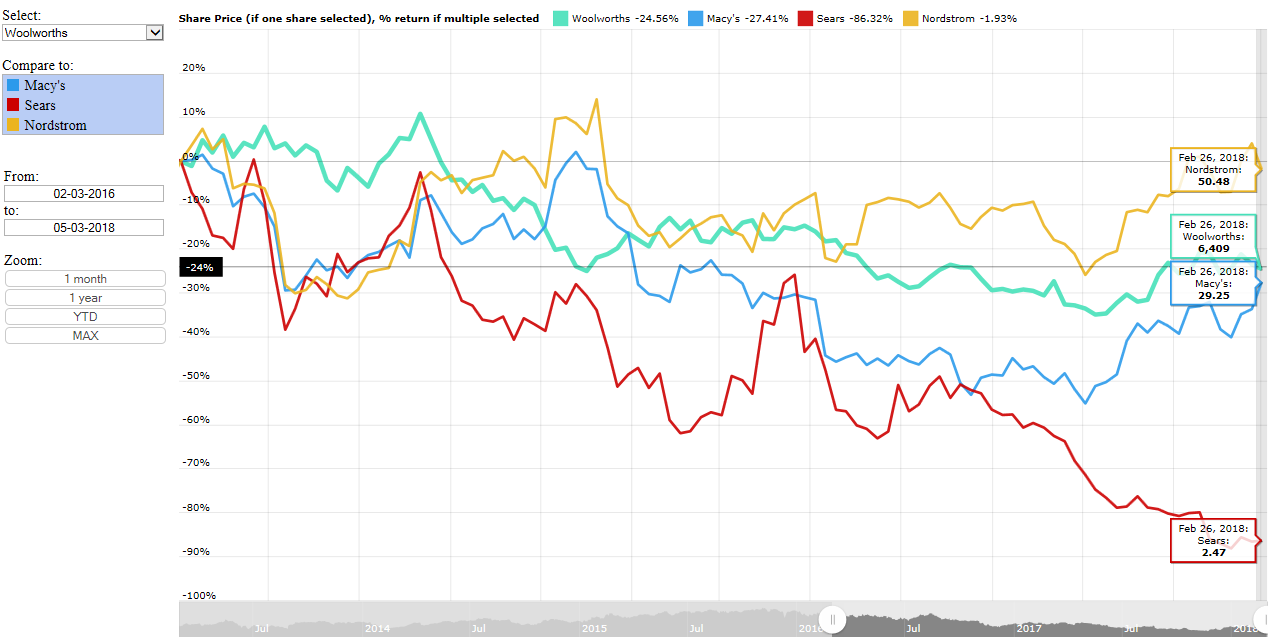
While Woolies share price has fallen by almost 25% over the last 24months, the share price of Sears has decline by almost 87% over the same period of time, while that of Macy's has gone down by almost 28%. With Nordstrom share price showing a slight decline of 1.9%. The results above does not paint a pretty picture of the retail and in particular the high end retail sector, with all of the former market darling department stores taking a beating. 

Let us know what you thought of this article:


Additional content:

Related Topics

  • ​Rand Dollar Exchange Rate


​Homepage

Economics Page
Stock in Focus Page


​About


Contact Us

Copyright © 2015
  • Home
  • Blog
    • Blog-5Jun2018
    • Blog-18May2018
    • Blog-16May2018
    • Blog-3May2018
    • Blog-2May2018
    • Blog-30Apr2018
    • Blog-26Apr2018
    • Blog-24Apr2018
    • Blog-18Apr2018
    • Blog-17Apr2018
    • Blog-16Apr2018
    • Blog-3Apr2018
    • Blog-22Mar2018
    • Blog-20Mar2018
    • Blog-19Mar2018
    • Blog-23Oct2017
    • Blog-20Oct2017
    • Blog-11Oct2017
    • Blog-10Oct2017
    • Blog-6Oct2017
    • Blog-3Oct2017
    • Blog-2Oct2017
  • Economics
    • Rand Dollar Exchange Rate
    • South Africa's GDP
    • South Africa's Unemployment
    • SA by numbers
    • Economic Progress Index
    • Taylors Rule
    • South Africa's Formal Business Sector
    • South-Africa's-Fiscal-Policy
    • SA EU Trade Data
    • Inflation Heat Map
    • Population Density Map
    • Labour Market Dynamics
    • Estimating the Size of the Informal Economy
    • SA Consumer Spending Patterns
    • South Africa's Monetary Fiscal Policy Mix
    • GDP Animations >
      • SouthAfrica
      • WesternCape
      • EasternCape
      • NorthernCape
      • FreeState
      • KwaZuluNatal
      • NorthWest
      • Gauteng
      • Mpumalanga
      • Limpopo
    • South Africa's Economic Structure
    • South Africa's Economic History
    • South Africa's Trade Data Page
    • South Africa's Food and Beverages Sector
    • Financial Well-being of South African Companies_2015
    • SA vs the World
    • Budget Day Page (24 Feb 2016)
  • Stock in Focus
    • JSE ALSI Chart
    • Sector Comparison Page
    • JSE-Calendar-Tracker-2019
    • Adcorp (ADR)
    • Amazon (AMZN)
    • Apple (AAPL)
    • Ascendis (ASC)
    • AVI (AVI)
    • Bidvest (BVT)
    • Blue Label Telecoms (BLU)
    • Bowler Metcalf (BCF)
    • Capitec (CPI)
    • City Lodge Hotel Group
    • Clicks Group (CLS)
    • Coronation (CML)
    • Curro Holdings (COH)
    • Discovery (DSY)
    • Distell (DST)
    • EOH (EOH)
    • Famous Brands (FBR)
    • Ferrari (RACE)
    • FirstRand Group (FSR)
    • Grindrod (GND)
    • GrowthPoint (GRT)
    • Holdsport (HSP)
    • Harley-Davidson (HOG)
    • Hyprop (HYP)
    • Hyprop (HYP)_1Jun2016
    • Investec Property Fund (IPF)
    • JSE (JSE)
    • Massmart (MSM)
    • MediClinic (MEI)
    • MTN (MTN)
    • MTN (MTN)_May2016
    • Mr Price Group (MRP)
    • Mr Price Group (MRP)_8APR2016
    • Nedbank (NED)
    • OneLogix (OLG)
    • Peregrine Holdings (PGR)
    • Pick 'n Pay Stores (PIK)
    • Pioneer Foods (PFG)
    • PSG Group (PSG)
    • Quantum Foods (QFH)
    • RCL Foods (RCL)
    • Remgro (REM)
    • Richemont (CFR)
    • RMB Holdings (RMH)
    • Rolfes (RLF)
    • Sanlam (SLM)
    • Sasol (SOL)
    • Sasol (SOL)_18sep2016
    • Santova (SNV)
    • Spar Group (SPP)
    • Shoprite Holdings (SHP)
    • Spur Corporation (SUR)_7Sep2017
    • Standard Bank (SBK)
    • Steinhoff International Holdings (SNH)
    • Stor-Age (SSS)
    • Super Group (SPG)
    • Taste Holdings (TAS)_30May2016
    • The Foshini Group (TFG)
    • Value Logistics (VLE)
    • Vodacom (VOD)
    • Wilson Bayly Holmes Ovcon (WBO)
    • Woolworths (WHL)
    • Woolworths (WHL)_24Aug2017
    • Zeder (ZED)
  • Online Calculators
    • Rand Petrol Price Estimator
    • Share Valuation
    • Financial Ratios Calculator
    • GDP Growth Estimator
    • Future Value of Investment Calculator
    • Loan repayment calculator
  • Contact
  • About
  • Search