|
Related Topics |
|
Recently there has been a lot of excitement regarding Naspers (NPN) substantial share price growth, with twitter being set alight with hashtags such as #NPN4000 and #NPN5000. We know of one twitter user swearing by it (yes Johann Biermann we are talking about you.) Follow him @johannbiermann1
We take a look at the share price growth of Naspers vs Tencent over the last 5 years. All data obtained from PSG. Find them at www.PSG.co.za |
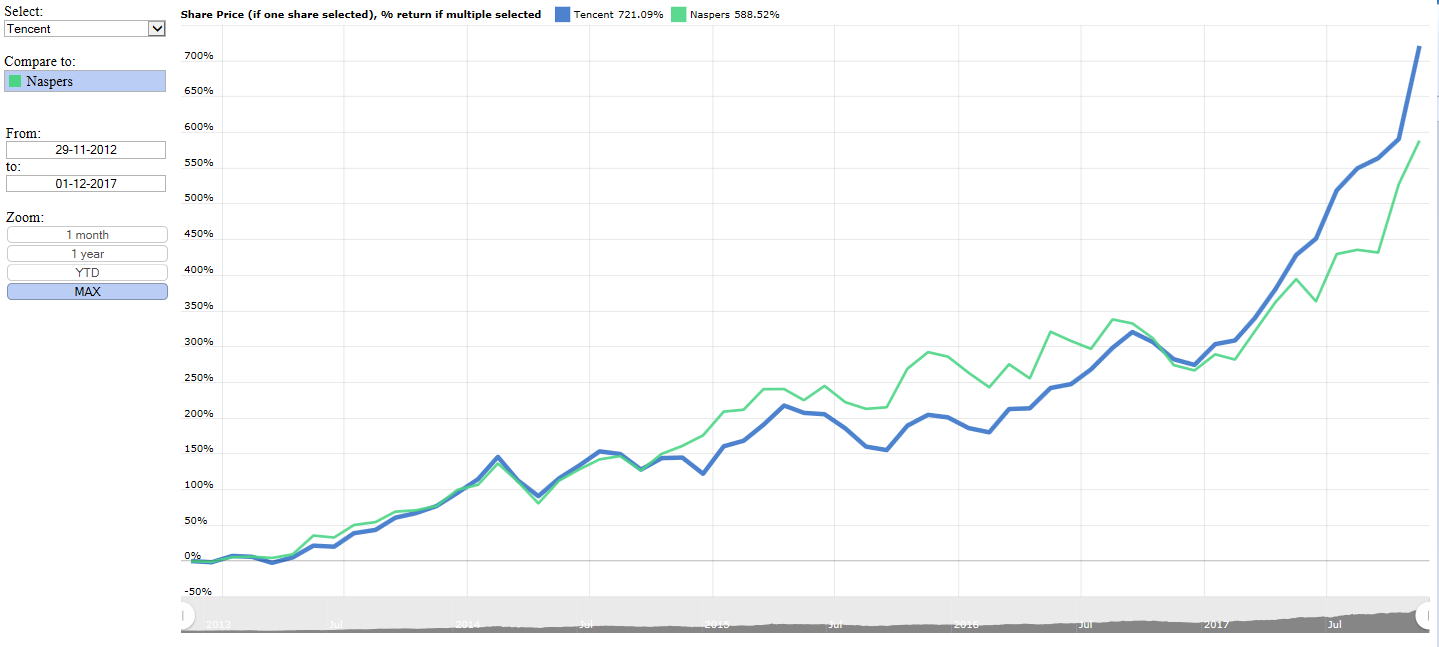
Naspers Share Price growth over 5 years compared to that of their biggest holding Tencent
|
Does Naspers (NPN) have more legs?
The question is does NPN have legs to go even higher?
Well based on the share price movement of their biggest holding, Tencent one might be tempted to say it definitely has legs to go a lot higher, considering the fact that Naspers's share price has only gone up by a mind boggling 589% over the last 5 years, compared to that of their biggest holding, Tencent which has gone up by a staggering 721% over the same period. Even on a year to date basis, Tencent has outpaced Naspers, with its share price having gone up by 113% compared to Naspers' 78%
The chart below shows the share price of Tencent over the last 5 years. Once users select Naspers (Top left under compare to:), the graphic will show the returns made by each share for whichever dates users under, or based on the Zoom box selected:
For those who still know nothing about Tencent or Naspers please see below for a bit more detail on both firms:
Tencent:
Founded in November, 1998, Tencent is a leading provider of Internet value added services in China. Since its establishment, Tencent has maintained steady growth under its user-oriented operating strategies. On June 16, 2004, Tencent Holdings Limited (SEHK 700) went public on the main board of the Hong Kong Stock Exchange.
It is Tencent's mission to enhance the quality of human life through Internet services. Presently, Tencent provides social platforms and digital content services under the “Connection” Strategy. Tencent’s leading Internet platforms in China – QQ (QQ Instant Messenger), Weixin/WeChat, QQ.com, QQ Games, Qzone, and Tenpay – have brought together China's largest Internet community, to meet the various needs of Internet users including communication, information, entertainment, financial services and others. As of March 31, 2017, the monthly active user accounts of QQ was 861 million while its peak concurrent user accounts reached 266 million. Combined MAU of Weixin and WeChat was 938 million. The development of Tencent has profoundly influenced the ways hundreds of millions of Internet users communicate with one another as well as their lifestyles. It also brings possibilities of a wider range of applications to the China’s Internet industry.
Looking forward, Tencent remains committed to enhancing its development and innovation capabilities while strengthening its nationwide branding for its long term development. More than 50% of Tencent employees are R&D staff. Tencent has obtained patents relating to the technologies in various areas: instant messaging, e-commerce, online payment services, search engine, information security, gaming, and many more. In 2007, Tencent invested more than RMB100 million in setting up the Tencent Research Institute, China's first Internet research institute, with campuses in Beijing, Shanghai, and Shenzhen. The institute focuses on the self-development of core Internet technologies, in pursuing its development and innovation for the industry.
Tencent's long term vision is to become the most respected Internet enterprise. In order to fulfill corporate social responsibilities and to promote civil Internet communities, Tencent has been actively participating in public charity programs. In 2006, Tencent inaugurated the Tencent Charity Fund, the first charity foundation set up by a Chinese Internet enterprise, and the public charity website gongyi.qq.com. The website focuses on youth education, assisting impoverished communities, care for the disadvantaged, and disaster relief. Tencent has currently begun a number of public charity projects across China. It strives to help build a harmonious society and to become a good corporate citizen.
Naspers:
Founded in 1915, Naspers is a global internet and entertainment group and one of the largest technology investors in the world. Operating in more than 120 countries and markets with long-term growth potential, Naspers builds leading companies that empower people and enrich communities.
We run some of the world's leading platforms in internet, video entertainment and media. The group has sizeable investments in Tencent (SEHK 00700), Mail.ru (LSE: MAIL), MakeMyTrip Limited (NASDAQ:MMYT) and Flipkart. Naspers is listed on the Johannesburg Stock Exchange (NPN.SJ) and has an ADR listing on the London Stock Exchange (LSE: NPSN). Today, the Naspers group is organised into six business areas: Classifieds, Payments, B2C eCommerce, Ventures, Video Entertainment, and Media. We also hold sizable investments in listed assets Tencent, Mail.ru and MakeMyTrip Limited. Our Classifieds business provides mobile and digital local marketplaces that connect more than 300 million buyers and sellers every month in more than 40 countries around the world. Our companies OLX, Avito and letgo have the #1 mobile classifieds app in more than 20 countries.
PayU is one of the largest Payment Service Platforms in the world, focusing on markets with long-term growth potential. It has leading positions across Africa and the Middle East, Central and Eastern Europe, India, and Latin America. PayU’s 250 payment options enable safe transactions in 16 countries for more than 160,000 merchants, allowing them to focus on reaching the 2.2 billion consumers in our markets.
Our B2C eCommerce segment contains our business to consumer e-commerce companies and investments. These businesses are leading players in Latin America, Central and Eastern Europe, the Middle East and Africa and include eMAG, Flipkart, Konga and Takealot, as well as our investment in the leading online travel business in India, MakeMyTrip Limited.
Below an image showing some of Nasper's main brands and investments. South Africans are sure to recognize a number of the brands in the image below.
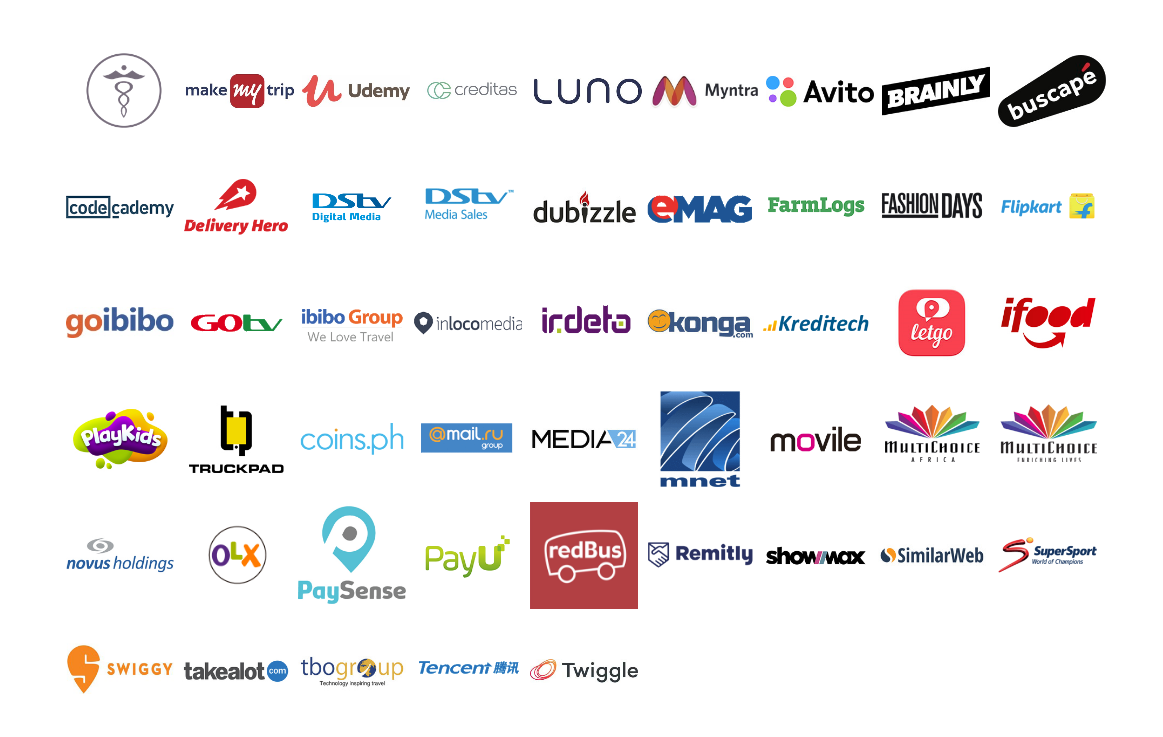
An image showing all Nasper's main brands and investments
Let us know what you thought of this article: |