South African Market Insights
  • Home
  • Blog
    • Blog-5Jun2018
    • Blog-18May2018
    • Blog-16May2018
    • Blog-3May2018
    • Blog-2May2018
    • Blog-30Apr2018
    • Blog-26Apr2018
    • Blog-24Apr2018
    • Blog-18Apr2018
    • Blog-17Apr2018
    • Blog-16Apr2018
    • Blog-3Apr2018
    • Blog-22Mar2018
    • Blog-20Mar2018
    • Blog-19Mar2018
    • Blog-23Oct2017
    • Blog-20Oct2017
    • Blog-11Oct2017
    • Blog-10Oct2017
    • Blog-6Oct2017
    • Blog-3Oct2017
    • Blog-2Oct2017
  • Economics
    • Rand Dollar Exchange Rate
    • South Africa's GDP
    • South Africa's Unemployment
    • SA by numbers
    • Economic Progress Index
    • Taylors Rule
    • South Africa's Formal Business Sector
    • South-Africa's-Fiscal-Policy
    • SA EU Trade Data
    • Inflation Heat Map
    • Population Density Map
    • Labour Market Dynamics
    • Estimating the Size of the Informal Economy
    • SA Consumer Spending Patterns
    • South Africa's Monetary Fiscal Policy Mix
    • GDP Animations >
      • SouthAfrica
      • WesternCape
      • EasternCape
      • NorthernCape
      • FreeState
      • KwaZuluNatal
      • NorthWest
      • Gauteng
      • Mpumalanga
      • Limpopo
    • South Africa's Economic Structure
    • South Africa's Economic History
    • South Africa's Trade Data Page
    • South Africa's Food and Beverages Sector
    • Financial Well-being of South African Companies_2015
    • SA vs the World
    • Budget Day Page (24 Feb 2016)
  • Stock in Focus
    • JSE ALSI Chart
    • Sector Comparison Page
    • JSE-Calendar-Tracker-2019
    • Adcorp (ADR)
    • Amazon (AMZN)
    • Apple (AAPL)
    • Ascendis (ASC)
    • AVI (AVI)
    • Bidvest (BVT)
    • Blue Label Telecoms (BLU)
    • Bowler Metcalf (BCF)
    • Capitec (CPI)
    • City Lodge Hotel Group
    • Clicks Group (CLS)
    • Coronation (CML)
    • Curro Holdings (COH)
    • Discovery (DSY)
    • Distell (DST)
    • EOH (EOH)
    • Famous Brands (FBR)
    • Ferrari (RACE)
    • FirstRand Group (FSR)
    • Grindrod (GND)
    • GrowthPoint (GRT)
    • Holdsport (HSP)
    • Harley-Davidson (HOG)
    • Hyprop (HYP)
    • Hyprop (HYP)_1Jun2016
    • Investec Property Fund (IPF)
    • JSE (JSE)
    • Massmart (MSM)
    • MediClinic (MEI)
    • MTN (MTN)
    • MTN (MTN)_May2016
    • Mr Price Group (MRP)
    • Mr Price Group (MRP)_8APR2016
    • Nedbank (NED)
    • OneLogix (OLG)
    • Peregrine Holdings (PGR)
    • Pick 'n Pay Stores (PIK)
    • Pioneer Foods (PFG)
    • PSG Group (PSG)
    • Quantum Foods (QFH)
    • RCL Foods (RCL)
    • Remgro (REM)
    • Richemont (CFR)
    • RMB Holdings (RMH)
    • Rolfes (RLF)
    • Sanlam (SLM)
    • Sasol (SOL)
    • Sasol (SOL)_18sep2016
    • Santova (SNV)
    • Spar Group (SPP)
    • Shoprite Holdings (SHP)
    • Spur Corporation (SUR)_7Sep2017
    • Standard Bank (SBK)
    • Steinhoff International Holdings (SNH)
    • Stor-Age (SSS)
    • Super Group (SPG)
    • Taste Holdings (TAS)_30May2016
    • The Foshini Group (TFG)
    • Value Logistics (VLE)
    • Vodacom (VOD)
    • Wilson Bayly Holmes Ovcon (WBO)
    • Woolworths (WHL)
    • Woolworths (WHL)_24Aug2017
    • Zeder (ZED)
  • Online Calculators
    • Rand Petrol Price Estimator
    • Share Valuation
    • Financial Ratios Calculator
    • GDP Growth Estimator
    • Future Value of Investment Calculator
    • Loan repayment calculator
  • Contact
  • About
  • Search

< What the Big Mac index says about the value of the rand
Economics Main Page >

Germany vs United States of America. Who does SA export more to?

Category: Economics and international trade
Date: 29 May 2018 

Related Topics

In today's blog post we take a look at South Africa's exports to two of South Africa's biggest export markets, which is the United States and Germany. How much are South Africa exporting to these countries? And what exactly are we exporting to them? We take a look below.
Picture
  • SA vs World
  • SA's trade data page

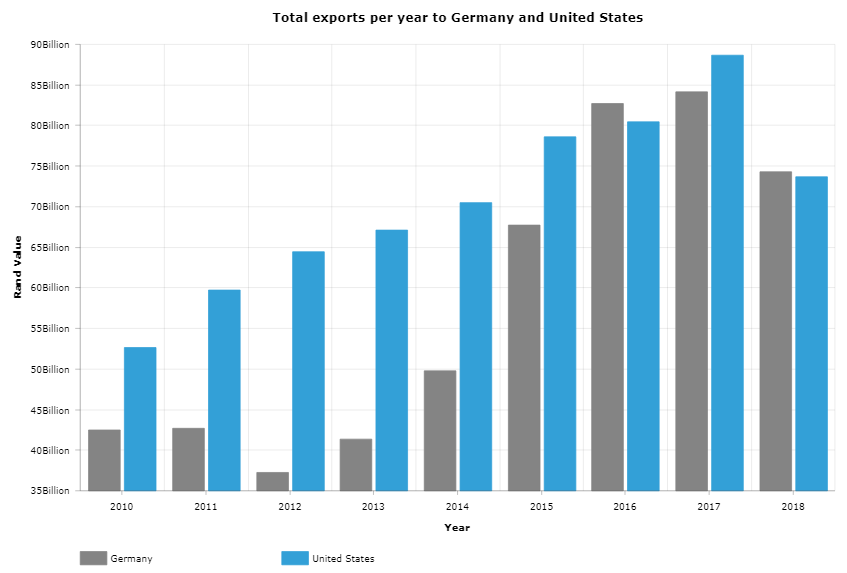
Total Exports per year to both Germany and United States

The bar chart below shows the total value of exports from South Africa per year, to both Germany and the United States. Please take note the 2018 values are estimated based on the amount of trade with this countries for the first 3 months of the year.
chart created with amCharts | amCharts
From the bar chart above it is clear that South Africa's exports more in terms of Rand value to the United States than to Germany. From the start of 2010 up to the estimated end of 2018 South Africa would have exported the following amounts to Germany and the United States:
  • United States: R635.8billion
  • Germany: R522.65billion 
So the next question is what exactly are we exporting to Germany and the United States? Are the products similar or does it vary between the two countries?

The graphic below shows the Top 30 exports to Germany since January 2010:

chart created with amCharts | amCharts
While the graphic below shows the Top 30 exports from South  Africa since the start of January 2010 to the United States of America.
chart created with amCharts | amCharts
The image below provides a tabulated summary of the Top 30 exports to Germany and United States from South Africa from the start of 2010.
Picture
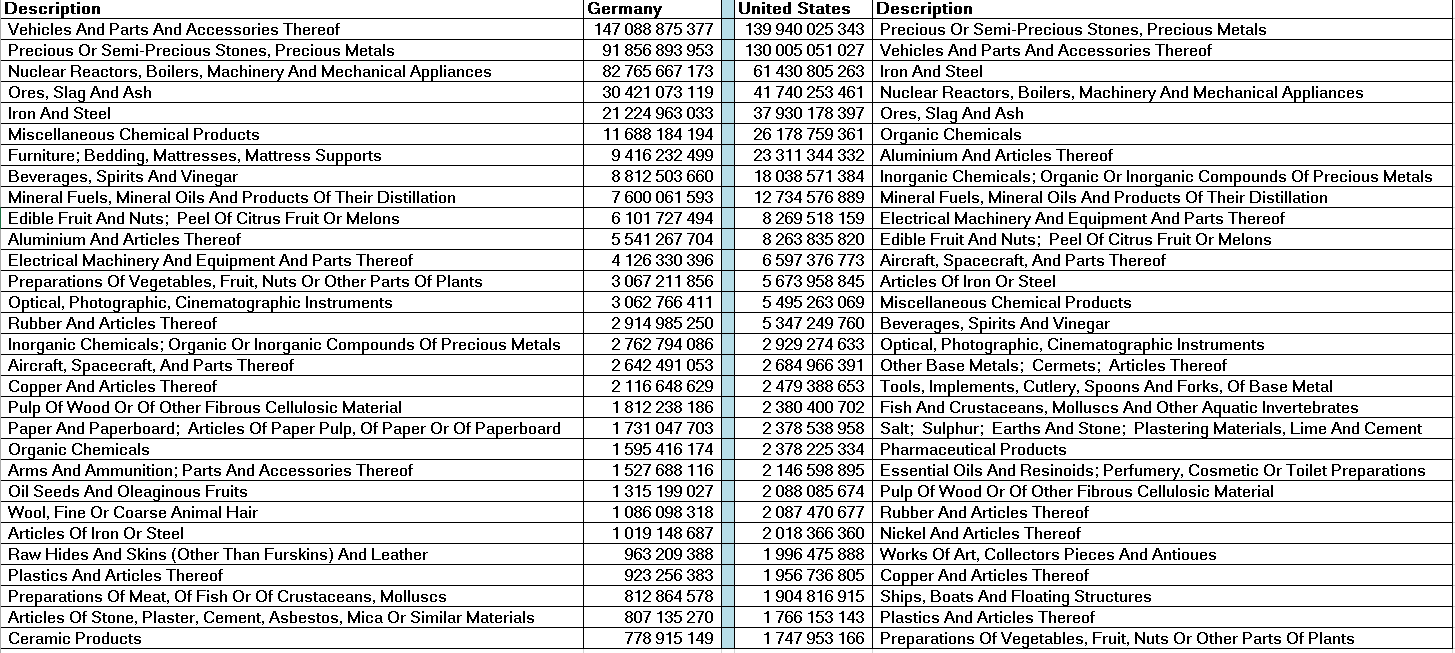
For those that cannot the the image for some reason, below a summary of the Top 30 exports to Germany and the United States from South Africa from the start of 2010.

Germany: (Total Rand Value shown after the description)
  •  Vehicles And Parts And Accessories Thereof : R147 088 875 377
  •  Precious Or Semi-Precious Stones, Precious Metals:     R91 856 893 953
  •  Nuclear Reactors, Boilers, Machinery And Mechanical Appliances:     R82 765 667 173
  •  Ores, Slag And Ash :    R30 421 073 119
  •  Iron And Steel :    R21 224 963 033
  •  Miscellaneous Chemical Products:     R11 688 184 194
  •  Furniture; Bedding, Mattresses, Mattress Supports:       R9 416 232 499
  •  Beverages, Spirits And Vinegar :      R8 812 503 660
  •  Mineral Fuels, Mineral Oils And Products Of Their Distillation:       R7 600 061 593
  •  Edible Fruit And Nuts;  Peel Of Citrus Fruit Or Melons :      R6 101 727 494
  •  Aluminium And Articles Thereof :      R5 541 267 704
  •  Electrical Machinery And Equipment And Parts Thereof:       R4 126 330 396
  •  Preparations Of Vegetables, Fruit, Nuts Or Other Parts Of Plants:       R3 067 211 856
  •  Optical, Photographic, Cinematographic Instruments:       R3 062 766 411
  •  Rubber And Articles Thereof :      R2 914 985 250
  •  Inorganic Chemicals; Organic Or Inorganic Compounds Of Precious Metals:       R2 762 794 086
  •  Aircraft, Spacecraft, And Parts Thereof :      R2 642 491 053
  •  Copper And Articles Thereof :      R2 116 648 629
  •  Pulp Of Wood Or Of Other Fibrous Cellulosic Material :      R1 812 238 186
  •  Paper And Paperboard;  Articles Of Paper Pulp, Of Paper Or Of Paperboard  :     R1 731 047 703
  •  Organic Chemicals:       R1 595 416 174
  •  Arms And Ammunition; Parts And Accessories Thereof:       R1 527 688 116
  •  Oil Seeds And Oleaginous Fruits :      R1 315 199 027
  •  Wool, Fine Or Coarse Animal Hair :      R1 086 098 318
  •  Articles Of Iron Or Steel :      R1 019 148 687
  •  Raw Hides And Skins (Other Than Furskins) And Leather:          R963 209 388
  •  Plastics And Articles Thereof :         R923 256 383
  •  Preparations Of Meat, Of Fish Or Of Crustaceans, Molluscs :         R812 864 578
  •  Articles Of Stone, Plaster, Cement, Asbestos, Mica Or Similar Materials:          R807 135 270
  •  Ceramic Products :         R778 915 149

United States: (Total Rand Value shown after the description)
  •  Precious Or Semi-Precious Stones, Precious Metals: R 139 940 025 343
  •  Vehicles And Parts And Accessories Thereof : R 130 005 051 027
  •  Iron And Steel : R 61 430 805 263
  •  Nuclear Reactors, Boilers, Machinery And Mechanical Appliances: R 41 740 253 461
  •  Ores, Slag And Ash: R 37 930 178 397
  •  Organic Chemicals :R 26 178 759 361
  •  Aluminium And Articles Thereof: R 23 311 344 332
  •  Inorganic Chemicals; Organic Or Inorganic Compounds Of Precious Metals: R 18 038 571 384
  •  Mineral Fuels, Mineral Oils And Products Of Their Distillation: R 12 734 576 889
  •  Electrical Machinery And Equipment And Parts Thereof: R 8 269 518 159
  •  Edible Fruit And Nuts;  Peel Of Citrus Fruit Or Melons: R 8 263 835 820
  •  Aircraft, Spacecraft, And Parts Thereof: R 6 597 376 773
  •  Articles Of Iron Or Steel: R 5 673 958 845
  •  Miscellaneous Chemical Products: R 5 495 263 069
  •  Beverages, Spirits And Vinegar: R 5 347 249 760
  •  Optical, Photographic, Cinematographic Instruments: R 2 929 274 633
  •  Other Base Metals;  Cermets;  Articles Thereof: R 2 684 966 391
  •  Tools, Implements, Cutlery, Spoons And Forks, Of Base Metal: R 2 479 388 653
  •  Fish And Crustaceans, Molluscs And Other Aquatic Invertebrates: R 2 380 400 702
  •  Salt;  Sulphur;  Earths And Stone;  Plastering Materials, Lime And Cement: R 2 378 538 958
  •  Pharmaceutical Products: R 2 378 225 334
  •  Essential Oils And Resinoids; Perfumery, Cosmetic Or Toilet Preparations: R 2 146 598 895
  •  Pulp Of Wood Or Of Other Fibrous Cellulosic Material: R 2 088 085 674
  •  Rubber And Articles Thereof: R 2 087 470 677
  •  Nickel And Articles Thereof: R 2 018 366 360
  •  Works Of Art, Collectors Pieces And Antiques: R 1 996 475 888
  •  Copper And Articles Thereof :R 1 956 736 805
  •  Ships, Boats And Floating Structures: R 1 904 816 915
  •  Plastics And Articles Thereof :R 1 766 153 143
  •  Preparations Of Vegetables, Fruit, Nuts Or Other Parts Of Plants : R 1 747 953 166

Readers will note that the top few products being exported from South Africa such as precious metals, iron and steel, vehicles, nuclear reactors/broilers, Ores and slash  appear highly in both exports to Germany and the United States. A sign that South Africa's main exports to some of its main export markets are very similar, perhaps highlighting the fact  that South Africa does not have a very diverse set of goods/services it exports to the world, and that it is largely commodities and minerals it exports (as well as vehicles as it has big vehicle manufacturing capabilities).​

Additional content

Related Topics

  • SA vs World
  • SA's trade data page​


​Homepage

Economics Page
Stock in Focus Page


​About


Contact Us

Copyright © 2015
  • Home
  • Blog
    • Blog-5Jun2018
    • Blog-18May2018
    • Blog-16May2018
    • Blog-3May2018
    • Blog-2May2018
    • Blog-30Apr2018
    • Blog-26Apr2018
    • Blog-24Apr2018
    • Blog-18Apr2018
    • Blog-17Apr2018
    • Blog-16Apr2018
    • Blog-3Apr2018
    • Blog-22Mar2018
    • Blog-20Mar2018
    • Blog-19Mar2018
    • Blog-23Oct2017
    • Blog-20Oct2017
    • Blog-11Oct2017
    • Blog-10Oct2017
    • Blog-6Oct2017
    • Blog-3Oct2017
    • Blog-2Oct2017
  • Economics
    • Rand Dollar Exchange Rate
    • South Africa's GDP
    • South Africa's Unemployment
    • SA by numbers
    • Economic Progress Index
    • Taylors Rule
    • South Africa's Formal Business Sector
    • South-Africa's-Fiscal-Policy
    • SA EU Trade Data
    • Inflation Heat Map
    • Population Density Map
    • Labour Market Dynamics
    • Estimating the Size of the Informal Economy
    • SA Consumer Spending Patterns
    • South Africa's Monetary Fiscal Policy Mix
    • GDP Animations >
      • SouthAfrica
      • WesternCape
      • EasternCape
      • NorthernCape
      • FreeState
      • KwaZuluNatal
      • NorthWest
      • Gauteng
      • Mpumalanga
      • Limpopo
    • South Africa's Economic Structure
    • South Africa's Economic History
    • South Africa's Trade Data Page
    • South Africa's Food and Beverages Sector
    • Financial Well-being of South African Companies_2015
    • SA vs the World
    • Budget Day Page (24 Feb 2016)
  • Stock in Focus
    • JSE ALSI Chart
    • Sector Comparison Page
    • JSE-Calendar-Tracker-2019
    • Adcorp (ADR)
    • Amazon (AMZN)
    • Apple (AAPL)
    • Ascendis (ASC)
    • AVI (AVI)
    • Bidvest (BVT)
    • Blue Label Telecoms (BLU)
    • Bowler Metcalf (BCF)
    • Capitec (CPI)
    • City Lodge Hotel Group
    • Clicks Group (CLS)
    • Coronation (CML)
    • Curro Holdings (COH)
    • Discovery (DSY)
    • Distell (DST)
    • EOH (EOH)
    • Famous Brands (FBR)
    • Ferrari (RACE)
    • FirstRand Group (FSR)
    • Grindrod (GND)
    • GrowthPoint (GRT)
    • Holdsport (HSP)
    • Harley-Davidson (HOG)
    • Hyprop (HYP)
    • Hyprop (HYP)_1Jun2016
    • Investec Property Fund (IPF)
    • JSE (JSE)
    • Massmart (MSM)
    • MediClinic (MEI)
    • MTN (MTN)
    • MTN (MTN)_May2016
    • Mr Price Group (MRP)
    • Mr Price Group (MRP)_8APR2016
    • Nedbank (NED)
    • OneLogix (OLG)
    • Peregrine Holdings (PGR)
    • Pick 'n Pay Stores (PIK)
    • Pioneer Foods (PFG)
    • PSG Group (PSG)
    • Quantum Foods (QFH)
    • RCL Foods (RCL)
    • Remgro (REM)
    • Richemont (CFR)
    • RMB Holdings (RMH)
    • Rolfes (RLF)
    • Sanlam (SLM)
    • Sasol (SOL)
    • Sasol (SOL)_18sep2016
    • Santova (SNV)
    • Spar Group (SPP)
    • Shoprite Holdings (SHP)
    • Spur Corporation (SUR)_7Sep2017
    • Standard Bank (SBK)
    • Steinhoff International Holdings (SNH)
    • Stor-Age (SSS)
    • Super Group (SPG)
    • Taste Holdings (TAS)_30May2016
    • The Foshini Group (TFG)
    • Value Logistics (VLE)
    • Vodacom (VOD)
    • Wilson Bayly Holmes Ovcon (WBO)
    • Woolworths (WHL)
    • Woolworths (WHL)_24Aug2017
    • Zeder (ZED)
  • Online Calculators
    • Rand Petrol Price Estimator
    • Share Valuation
    • Financial Ratios Calculator
    • GDP Growth Estimator
    • Future Value of Investment Calculator
    • Loan repayment calculator
  • Contact
  • About
  • Search