South African Market Insights
  • Home
  • Blog
    • Blog-5Jun2018
    • Blog-18May2018
    • Blog-16May2018
    • Blog-3May2018
    • Blog-2May2018
    • Blog-30Apr2018
    • Blog-26Apr2018
    • Blog-24Apr2018
    • Blog-18Apr2018
    • Blog-17Apr2018
    • Blog-16Apr2018
    • Blog-3Apr2018
    • Blog-22Mar2018
    • Blog-20Mar2018
    • Blog-19Mar2018
    • Blog-23Oct2017
    • Blog-20Oct2017
    • Blog-11Oct2017
    • Blog-10Oct2017
    • Blog-6Oct2017
    • Blog-3Oct2017
    • Blog-2Oct2017
  • Economics
    • Rand Dollar Exchange Rate
    • South Africa's GDP
    • South Africa's Unemployment
    • SA by numbers
    • Economic Progress Index
    • Taylors Rule
    • South Africa's Formal Business Sector
    • South-Africa's-Fiscal-Policy
    • SA EU Trade Data
    • Inflation Heat Map
    • Population Density Map
    • Labour Market Dynamics
    • Estimating the Size of the Informal Economy
    • SA Consumer Spending Patterns
    • South Africa's Monetary Fiscal Policy Mix
    • GDP Animations >
      • SouthAfrica
      • WesternCape
      • EasternCape
      • NorthernCape
      • FreeState
      • KwaZuluNatal
      • NorthWest
      • Gauteng
      • Mpumalanga
      • Limpopo
    • South Africa's Economic Structure
    • South Africa's Economic History
    • South Africa's Trade Data Page
    • South Africa's Food and Beverages Sector
    • Financial Well-being of South African Companies_2015
    • SA vs the World
    • Budget Day Page (24 Feb 2016)
  • Stock in Focus
    • JSE ALSI Chart
    • Sector Comparison Page
    • JSE-Calendar-Tracker-2019
    • Adcorp (ADR)
    • Amazon (AMZN)
    • Apple (AAPL)
    • Ascendis (ASC)
    • AVI (AVI)
    • Bidvest (BVT)
    • Blue Label Telecoms (BLU)
    • Bowler Metcalf (BCF)
    • Capitec (CPI)
    • City Lodge Hotel Group
    • Clicks Group (CLS)
    • Coronation (CML)
    • Curro Holdings (COH)
    • Discovery (DSY)
    • Distell (DST)
    • EOH (EOH)
    • Famous Brands (FBR)
    • Ferrari (RACE)
    • FirstRand Group (FSR)
    • Grindrod (GND)
    • GrowthPoint (GRT)
    • Holdsport (HSP)
    • Harley-Davidson (HOG)
    • Hyprop (HYP)
    • Hyprop (HYP)_1Jun2016
    • Investec Property Fund (IPF)
    • JSE (JSE)
    • Massmart (MSM)
    • MediClinic (MEI)
    • MTN (MTN)
    • MTN (MTN)_May2016
    • Mr Price Group (MRP)
    • Mr Price Group (MRP)_8APR2016
    • Nedbank (NED)
    • OneLogix (OLG)
    • Peregrine Holdings (PGR)
    • Pick 'n Pay Stores (PIK)
    • Pioneer Foods (PFG)
    • PSG Group (PSG)
    • Quantum Foods (QFH)
    • RCL Foods (RCL)
    • Remgro (REM)
    • Richemont (CFR)
    • RMB Holdings (RMH)
    • Rolfes (RLF)
    • Sanlam (SLM)
    • Sasol (SOL)
    • Sasol (SOL)_18sep2016
    • Santova (SNV)
    • Spar Group (SPP)
    • Shoprite Holdings (SHP)
    • Spur Corporation (SUR)_7Sep2017
    • Standard Bank (SBK)
    • Steinhoff International Holdings (SNH)
    • Stor-Age (SSS)
    • Super Group (SPG)
    • Taste Holdings (TAS)_30May2016
    • The Foshini Group (TFG)
    • Value Logistics (VLE)
    • Vodacom (VOD)
    • Wilson Bayly Holmes Ovcon (WBO)
    • Woolworths (WHL)
    • Woolworths (WHL)_24Aug2017
    • Zeder (ZED)
  • Online Calculators
    • Rand Petrol Price Estimator
    • Share Valuation
    • Financial Ratios Calculator
    • GDP Growth Estimator
    • Future Value of Investment Calculator
    • Loan repayment calculator
  • Contact
  • About
  • Search

< "Junk Status" for South Africa. It's Real impact?
Economics Main Page >

 Blog: 29 July 2017 (Capital expenditure of the public sector in 2016)

Related Topics

In today's blog we take a look at South Africa's various public sector entities Capital Expenditure (Capex) for 2015 and 2016. Capex is capital expenditure on various fixed and operating assets including Land, buildings, machinery and equipment, transport equipment etc. With government promising to tighten it's belt with regards to its overall spending, has this affected capex, which one would expect to increase due to increased demand for the delivery of  services to the people of South Africa? The short answer to this is that it has not really affected the growth in capex, with it increasing by around 7% from 2015 to 2016.

Data source: Stats SA Capex of Public Sector
Picture
  • ​Inflation Heat Map
  • South Africa's Monetary Fiscal Policy Mix
  • SA's munfacturing under utilisation

Quick overview

The bar chart below shows the overall levels of capex for the main Public sector groups for both 2015 and 2016. 
chart created with amCharts | amCharts
As can be seen from the bar chart above, capex for the two years is dominated completely by Public Corporations (which include Eskom, Telkom, Transnet, Denel, water boards and various other entities).  Of the three groups Public Corporations make up 73.2% of capex in 2016, with National government departments making up 9.8% and Provincial government departments making up 19.2% of capex spending in 2016.
While capex has declined slightly for Public Corporations from 2015 to 2016 (-2.3%), there has been strong increases in capex of both national and provincial government departments, with their capex increasing by 13.2% and 17.2% respectively.

More detailed look at the three main public sector types

This section will take a more detailed look at the three different public sector types highlighted in the first graphic. We will start off by taking a more detailed look at the biggest contributors to capex, which is Public Corporations

Public Corporations

South African Public Corporations included but are not limited to the following list of entities:
  • Transnet
  • Telkom
  • Eskom
  • Denel
  • SABC
  • SABS
  • South African Post Office (SAPO)
  • South African Reserve Bank (SARB)
  • Onderstepoort
The bar chart below shows the difference in capex between 2015 and 2016 per Public Corporation for the 10 biggest increases in capex and the 10 biggest decliners in terms of capex.
chart created with amCharts | amCharts
Telkom, Eskom and Aiports company South Africa (ACSA) showed the biggest increases in capital expenditure from 2015 to 2016.  While Transnet, Komati Basin Water Authority and SANRAL (famous for their flopped E-tolls) showed the biggest declines in capital expenditure from 2015 to 2016.

While there is a lot of capex from various SOE's one has to wonder how much of it goes to corrupt deals (especially within Eskom and Transet with the Gupta connected Brian Molefe etc having spent time at both of these SOE's).

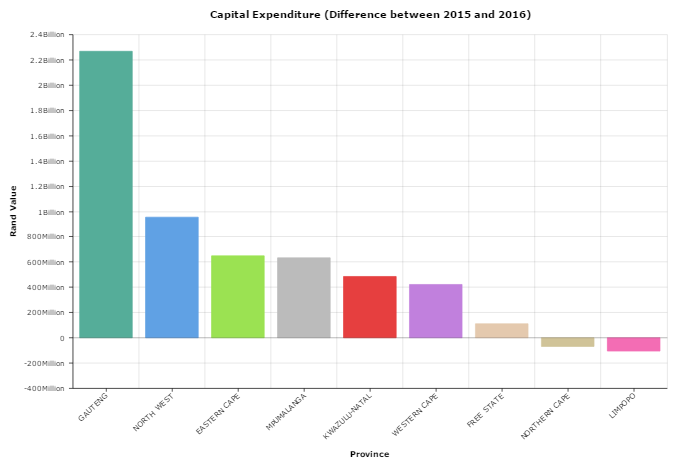
Provincial departments

Second biggest contributor to public sector capex is provincial departments. Below we take a look at South Africa's 9 provinces and their growth or decline in capex from 2015 to 2016. 
chart created with amCharts | amCharts
The graphic clearly shows that Gauteng increased their capex far more than any of the other provinces, with capex increasing over R2,2billion from 2015 to 2016, which is more than double the amount of the second biggest increase in capex, which was North West. Assumption one can make from this is increased demand for services from the public in Gauteng necessitates increased spending on capex. As we have shown in articles in the past, large sums of people are flooding to Gauteng, looking for work, placing ever increasing pressure on Gauteng's infrastructure.

National departments

The third biggest contributor to public sector capex is National departments. The graphic below shows the change in capex from 2015 to 2016 for ALL South Africa's national departments. The biggest increase was recorded for the Department of Water Affairs (no doubt the drought and continued issues at water treatment plants leading to increased capex spending of this department).
chart created with amCharts | amCharts
National department of basic education showed the biggest decline in capex from 2015 to 2016. Surprising to see is the department of defense close to the bottom too. One would think with a continued onslaught on SA's borders from illegal immigrants, and aging army vehicles, spending on capex would increase to ensure that SA's defense force can react should they ever need to. Be it to restore law and order in SA's cities or assisting in patrolling SA's borders.

While capex has increased by around 7% in the public sector,  the majority of that was driven by provincial governments, and not State owned entities as most would expect to be the case. Overall capex by state owned entities actually declined during the period (now if only we can see the same in their operational expenses such as salaries and other operating costs).


Related Topics

  • ​Inflation Heat Map
  • South Africa's Monetary Fiscal Policy Mix
  • SA's munfacturing under utilisation​


​Homepage

Economics Page
Stock in Focus Page


​About


Contact Us

Copyright © 2015
  • Home
  • Blog
    • Blog-5Jun2018
    • Blog-18May2018
    • Blog-16May2018
    • Blog-3May2018
    • Blog-2May2018
    • Blog-30Apr2018
    • Blog-26Apr2018
    • Blog-24Apr2018
    • Blog-18Apr2018
    • Blog-17Apr2018
    • Blog-16Apr2018
    • Blog-3Apr2018
    • Blog-22Mar2018
    • Blog-20Mar2018
    • Blog-19Mar2018
    • Blog-23Oct2017
    • Blog-20Oct2017
    • Blog-11Oct2017
    • Blog-10Oct2017
    • Blog-6Oct2017
    • Blog-3Oct2017
    • Blog-2Oct2017
  • Economics
    • Rand Dollar Exchange Rate
    • South Africa's GDP
    • South Africa's Unemployment
    • SA by numbers
    • Economic Progress Index
    • Taylors Rule
    • South Africa's Formal Business Sector
    • South-Africa's-Fiscal-Policy
    • SA EU Trade Data
    • Inflation Heat Map
    • Population Density Map
    • Labour Market Dynamics
    • Estimating the Size of the Informal Economy
    • SA Consumer Spending Patterns
    • South Africa's Monetary Fiscal Policy Mix
    • GDP Animations >
      • SouthAfrica
      • WesternCape
      • EasternCape
      • NorthernCape
      • FreeState
      • KwaZuluNatal
      • NorthWest
      • Gauteng
      • Mpumalanga
      • Limpopo
    • South Africa's Economic Structure
    • South Africa's Economic History
    • South Africa's Trade Data Page
    • South Africa's Food and Beverages Sector
    • Financial Well-being of South African Companies_2015
    • SA vs the World
    • Budget Day Page (24 Feb 2016)
  • Stock in Focus
    • JSE ALSI Chart
    • Sector Comparison Page
    • JSE-Calendar-Tracker-2019
    • Adcorp (ADR)
    • Amazon (AMZN)
    • Apple (AAPL)
    • Ascendis (ASC)
    • AVI (AVI)
    • Bidvest (BVT)
    • Blue Label Telecoms (BLU)
    • Bowler Metcalf (BCF)
    • Capitec (CPI)
    • City Lodge Hotel Group
    • Clicks Group (CLS)
    • Coronation (CML)
    • Curro Holdings (COH)
    • Discovery (DSY)
    • Distell (DST)
    • EOH (EOH)
    • Famous Brands (FBR)
    • Ferrari (RACE)
    • FirstRand Group (FSR)
    • Grindrod (GND)
    • GrowthPoint (GRT)
    • Holdsport (HSP)
    • Harley-Davidson (HOG)
    • Hyprop (HYP)
    • Hyprop (HYP)_1Jun2016
    • Investec Property Fund (IPF)
    • JSE (JSE)
    • Massmart (MSM)
    • MediClinic (MEI)
    • MTN (MTN)
    • MTN (MTN)_May2016
    • Mr Price Group (MRP)
    • Mr Price Group (MRP)_8APR2016
    • Nedbank (NED)
    • OneLogix (OLG)
    • Peregrine Holdings (PGR)
    • Pick 'n Pay Stores (PIK)
    • Pioneer Foods (PFG)
    • PSG Group (PSG)
    • Quantum Foods (QFH)
    • RCL Foods (RCL)
    • Remgro (REM)
    • Richemont (CFR)
    • RMB Holdings (RMH)
    • Rolfes (RLF)
    • Sanlam (SLM)
    • Sasol (SOL)
    • Sasol (SOL)_18sep2016
    • Santova (SNV)
    • Spar Group (SPP)
    • Shoprite Holdings (SHP)
    • Spur Corporation (SUR)_7Sep2017
    • Standard Bank (SBK)
    • Steinhoff International Holdings (SNH)
    • Stor-Age (SSS)
    • Super Group (SPG)
    • Taste Holdings (TAS)_30May2016
    • The Foshini Group (TFG)
    • Value Logistics (VLE)
    • Vodacom (VOD)
    • Wilson Bayly Holmes Ovcon (WBO)
    • Woolworths (WHL)
    • Woolworths (WHL)_24Aug2017
    • Zeder (ZED)
  • Online Calculators
    • Rand Petrol Price Estimator
    • Share Valuation
    • Financial Ratios Calculator
    • GDP Growth Estimator
    • Future Value of Investment Calculator
    • Loan repayment calculator
  • Contact
  • About
  • Search