|
Blog: 28 February 2018 (We take a look at the latest inflation numbers)
|
Related Topics |
|
In today's blog we take a look at South Africa's latest inflation numbers (for January 2018) as published by Statistics South Africa. We will look at the inflation rates of the various provinces as well as the inflation rates of the various income groups across South Africa.
Note all date obtained from Statistics South Africa (Stats SA) |

|
Mapping inflation: January 2018: 4.4%
While the overall rate of inflation experienced in South Africa was sitting at 4.4% year on year, there are large scale variations in the inflation rates experienced across the various provinces in South Africa. The main reason for this is the type of goods and the amount of money spent on various goods and services differs vastly across provinces. For example in Western Cape, KwaZulu-Natal and Gauteng, the percentage of money spent on luxury good such as cars are higher due to more affluent people staying in these provinces compared to say Northern Cape or Limpopo.
The poorer provinces tend to have a higher precentage of their overall spending allocated to essential goods and services such as food and clothing and the likes. The interactive heat map below shows the monthly inflation rate per province from the start of January 2014 up to January 2018. Users can select the month they want to look at from the drop down box, and can pause the animation at any time.
The poorer provinces tend to have a higher precentage of their overall spending allocated to essential goods and services such as food and clothing and the likes. The interactive heat map below shows the monthly inflation rate per province from the start of January 2014 up to January 2018. Users can select the month they want to look at from the drop down box, and can pause the animation at any time.
As the above interactive map shows, the Western Cape had the highest rate of inflation as recorded for the month of January 2018 with their year on year inflation rate sitting at 5.2%, which is far above the national number of 4.4%. While the North West had the lowest rate of inflation with their year on year inflation rate sitting at 2.9%. The two images below shows the inflation rate for the Western Cape and North West for January 2018.
Western Cape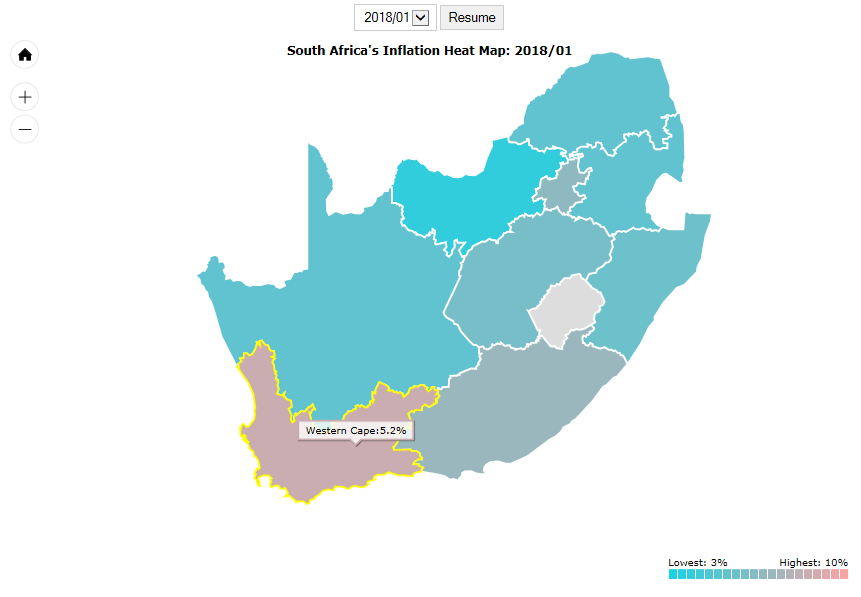
|
North West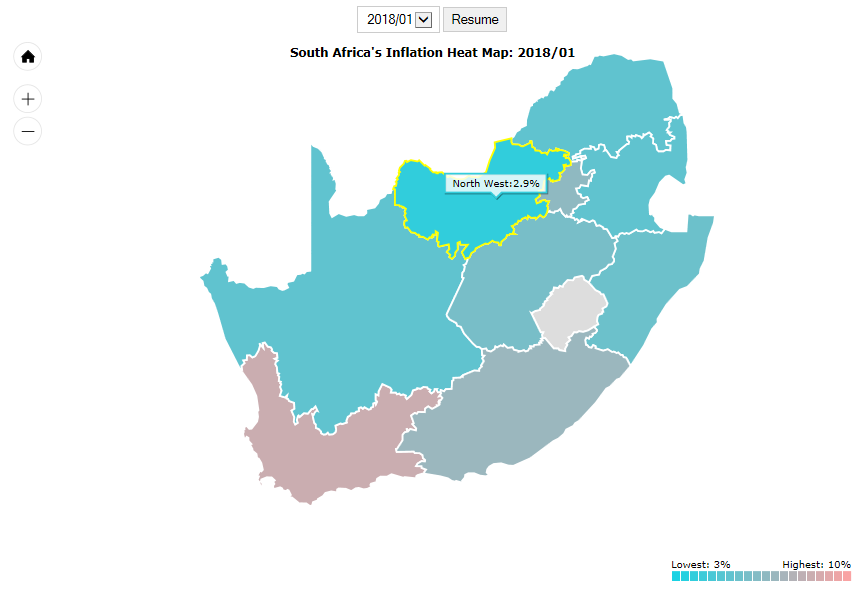
|
With inflation sitting right in the middle of the South African Reserve Bank inflation target one has to wonder if SARB will be looking to cut interest rates especially with South Africans high debt levels and South Africa's sluggish economic growth rates.
Below a summary of the inflation rates of the various provinces including the official inflation rate which is the inflation rate of All Urban Areas as well as the inflation rate of rural areas.
Western Cape 5.2%
All urban areas 4.4%
Gauteng 4.4%
Eastern Cape 4.2%
Free State 3.9%
Kwazulu-Natal 3.8%
Northern Cape 3.7%
Limpopo 3.7%
Mpumalanga 3.6%
Rural Areas 3.1%
North-West 2.9%
Inflation of the various expenditure groups
While this is often overlooked and just the headline number is quoted in the press, we feel it is important to shed some light in the inflation rate experienced by the different expenditure groups. The expenditure groups are grouped into 10 groups, with each group representing 10% of households, where Decile 1 is the poorest 10% of households and Decile 10 the richest 10% of households. Ever wondered what the inflation of the rich or the inflation of the poor is. Well the bar chart shows the inflation rate per expenditure decile in South Africa for January 2017 (and January 2018).
How quickly things change. In January 2017 the poorest of the poor had an inflation rate of 8.5% year on year, while the richest 10% had the lowest rate of inflation at the time with 6.5%. Now 12 months later (January 2018), the inflation of the poor has hardly moved compared to the year before, with the inflation rate of the poorest 10% sitting at just 1.1% which is far lower than the inflation rate of any of the other expenditure groups while the inflation of the richest 10% is now close to being the highest of all the expenditure groups. A significant reversal in the inflation trends for the expenditure groups.
This is largely due to the fact that the items the poor mostly buy, tend to vary greatly. Food prices are extremely volatile, while the more luxury goods and services which the richer groups spend their money on tend to be far more stable, as shown the gap between the January 2017 bars and January 2018 bars in the graphic above tend to be smaller for the richer expenditure groups, while for the poorer groups, the gaps between the January 2017 and January 2018 bars are substantial.
We will keep updating readers on not only the provincial inflation rates but also on the inflation of the rich and the poor
Let us know what you thought of this article: |