South African Market Insights
  • Home
  • Blog
    • Blog-5Jun2018
    • Blog-18May2018
    • Blog-16May2018
    • Blog-3May2018
    • Blog-2May2018
    • Blog-30Apr2018
    • Blog-26Apr2018
    • Blog-24Apr2018
    • Blog-18Apr2018
    • Blog-17Apr2018
    • Blog-16Apr2018
    • Blog-3Apr2018
    • Blog-22Mar2018
    • Blog-20Mar2018
    • Blog-19Mar2018
    • Blog-23Oct2017
    • Blog-20Oct2017
    • Blog-11Oct2017
    • Blog-10Oct2017
    • Blog-6Oct2017
    • Blog-3Oct2017
    • Blog-2Oct2017
  • Economics
    • Rand Dollar Exchange Rate
    • South Africa's GDP
    • South Africa's Unemployment
    • SA by numbers
    • Economic Progress Index
    • Taylors Rule
    • South Africa's Formal Business Sector
    • South-Africa's-Fiscal-Policy
    • SA EU Trade Data
    • Inflation Heat Map
    • Population Density Map
    • Labour Market Dynamics
    • Estimating the Size of the Informal Economy
    • SA Consumer Spending Patterns
    • South Africa's Monetary Fiscal Policy Mix
    • GDP Animations >
      • SouthAfrica
      • WesternCape
      • EasternCape
      • NorthernCape
      • FreeState
      • KwaZuluNatal
      • NorthWest
      • Gauteng
      • Mpumalanga
      • Limpopo
    • South Africa's Economic Structure
    • South Africa's Economic History
    • South Africa's Trade Data Page
    • South Africa's Food and Beverages Sector
    • Financial Well-being of South African Companies_2015
    • SA vs the World
    • Budget Day Page (24 Feb 2016)
  • Stock in Focus
    • JSE ALSI Chart
    • Sector Comparison Page
    • JSE-Calendar-Tracker-2019
    • Adcorp (ADR)
    • Amazon (AMZN)
    • Apple (AAPL)
    • Ascendis (ASC)
    • AVI (AVI)
    • Bidvest (BVT)
    • Blue Label Telecoms (BLU)
    • Bowler Metcalf (BCF)
    • Capitec (CPI)
    • City Lodge Hotel Group
    • Clicks Group (CLS)
    • Coronation (CML)
    • Curro Holdings (COH)
    • Discovery (DSY)
    • Distell (DST)
    • EOH (EOH)
    • Famous Brands (FBR)
    • Ferrari (RACE)
    • FirstRand Group (FSR)
    • Grindrod (GND)
    • GrowthPoint (GRT)
    • Holdsport (HSP)
    • Harley-Davidson (HOG)
    • Hyprop (HYP)
    • Hyprop (HYP)_1Jun2016
    • Investec Property Fund (IPF)
    • JSE (JSE)
    • Massmart (MSM)
    • MediClinic (MEI)
    • MTN (MTN)
    • MTN (MTN)_May2016
    • Mr Price Group (MRP)
    • Mr Price Group (MRP)_8APR2016
    • Nedbank (NED)
    • OneLogix (OLG)
    • Peregrine Holdings (PGR)
    • Pick 'n Pay Stores (PIK)
    • Pioneer Foods (PFG)
    • PSG Group (PSG)
    • Quantum Foods (QFH)
    • RCL Foods (RCL)
    • Remgro (REM)
    • Richemont (CFR)
    • RMB Holdings (RMH)
    • Rolfes (RLF)
    • Sanlam (SLM)
    • Sasol (SOL)
    • Sasol (SOL)_18sep2016
    • Santova (SNV)
    • Spar Group (SPP)
    • Shoprite Holdings (SHP)
    • Spur Corporation (SUR)_7Sep2017
    • Standard Bank (SBK)
    • Steinhoff International Holdings (SNH)
    • Stor-Age (SSS)
    • Super Group (SPG)
    • Taste Holdings (TAS)_30May2016
    • The Foshini Group (TFG)
    • Value Logistics (VLE)
    • Vodacom (VOD)
    • Wilson Bayly Holmes Ovcon (WBO)
    • Woolworths (WHL)
    • Woolworths (WHL)_24Aug2017
    • Zeder (ZED)
  • Online Calculators
    • Rand Petrol Price Estimator
    • Share Valuation
    • Financial Ratios Calculator
    • GDP Growth Estimator
    • Future Value of Investment Calculator
    • Loan repayment calculator
  • Contact
  • About
  • Search

< What the Big Mac index says about the value of the rand
Monetary Fiscal Policy Mix >

Blog: 25 February 2018 (South Africa's land size and population compared to the rest of Africa)

Related Topics

In today's blog we take a look at South Africa's land size and population compared to the rest of their African peers. Just how big is South Africa 's land mass compared to some of the other African countries. Or just how big is South Africa's population compared to the other African countries?
Picture
  • SA vs The World
  • ​SA''s trade data page

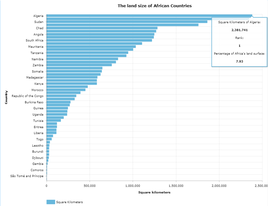
South Africa's land size compared to rest of Africa?

So just how big is South Africa's land area compared to its African peers? And how big is South Africa's population compared to the rest of Africa?  We answer the above questions with the graphics below.
chart created with amCharts | amCharts
The graphic above shows in descending order the land surface area of various countries as well is their rank in Africa and what percentage each country's surface area makes up of Africa's total land surface area. Note the figures were obtained from Wikipedia for the use in the graphic above. Algeria is Africa's biggest country in terms of land surface area, with it covering roughly 8% of the total surface area of the African country. The Democratic Republic of Congo is a close 2nd to Algeria , with it covering around 7.8% of the surface area of the African continent. South Africa comes in  at 9th place, with it making up around 4% of the total surface area of the Africa continent.​

The top 10 countries in terms of land size makes up almost 52% of the total surface area of the African continent. With the rest being made up by around 44 other countries. This show that the land surface area on the African continent varies greatly with a few countries with very large surface aeras and then others with relatively small surface areas.


South Africa's population compared to the rest of Africa

We now know what the  land area of the various countries in Africa . The next question is what the population of the various countries in Africa are and how South Africa's population compares to the rest of Africa. The graphic below is similar to the one above, except instead of looking at land surface area, we now look at population numbers.
chart created with amCharts | amCharts
From the graphic above it is clear that Nigeria is by far the biggest country in terms of population on the African continent with Nigeria making up roughly 15% of the total population on the African  continent. Ethiopia is the second biggest contributor to the  total population on the continent with it making up almost 9% of the total population in Africa, with Egypt in 3rd place with it making 7.5% of the population in Africa. South Africa comes in in 5th place with South Africa making up 4.7% of the total population of Africa.

The top 10 countries in terms of population makes up 61% of Africa's total population.  With the other 39% made up by over 40 other countries. Just showing how highly concentrated the population of the African continent is in a few countries.

Let us know what you thought of this article:


Additional content:

Related Topics

  • ​Rand Dollar Exchange Rate


​Homepage

Economics Page
Stock in Focus Page


​About


Contact Us

Copyright © 2015
  • Home
  • Blog
    • Blog-5Jun2018
    • Blog-18May2018
    • Blog-16May2018
    • Blog-3May2018
    • Blog-2May2018
    • Blog-30Apr2018
    • Blog-26Apr2018
    • Blog-24Apr2018
    • Blog-18Apr2018
    • Blog-17Apr2018
    • Blog-16Apr2018
    • Blog-3Apr2018
    • Blog-22Mar2018
    • Blog-20Mar2018
    • Blog-19Mar2018
    • Blog-23Oct2017
    • Blog-20Oct2017
    • Blog-11Oct2017
    • Blog-10Oct2017
    • Blog-6Oct2017
    • Blog-3Oct2017
    • Blog-2Oct2017
  • Economics
    • Rand Dollar Exchange Rate
    • South Africa's GDP
    • South Africa's Unemployment
    • SA by numbers
    • Economic Progress Index
    • Taylors Rule
    • South Africa's Formal Business Sector
    • South-Africa's-Fiscal-Policy
    • SA EU Trade Data
    • Inflation Heat Map
    • Population Density Map
    • Labour Market Dynamics
    • Estimating the Size of the Informal Economy
    • SA Consumer Spending Patterns
    • South Africa's Monetary Fiscal Policy Mix
    • GDP Animations >
      • SouthAfrica
      • WesternCape
      • EasternCape
      • NorthernCape
      • FreeState
      • KwaZuluNatal
      • NorthWest
      • Gauteng
      • Mpumalanga
      • Limpopo
    • South Africa's Economic Structure
    • South Africa's Economic History
    • South Africa's Trade Data Page
    • South Africa's Food and Beverages Sector
    • Financial Well-being of South African Companies_2015
    • SA vs the World
    • Budget Day Page (24 Feb 2016)
  • Stock in Focus
    • JSE ALSI Chart
    • Sector Comparison Page
    • JSE-Calendar-Tracker-2019
    • Adcorp (ADR)
    • Amazon (AMZN)
    • Apple (AAPL)
    • Ascendis (ASC)
    • AVI (AVI)
    • Bidvest (BVT)
    • Blue Label Telecoms (BLU)
    • Bowler Metcalf (BCF)
    • Capitec (CPI)
    • City Lodge Hotel Group
    • Clicks Group (CLS)
    • Coronation (CML)
    • Curro Holdings (COH)
    • Discovery (DSY)
    • Distell (DST)
    • EOH (EOH)
    • Famous Brands (FBR)
    • Ferrari (RACE)
    • FirstRand Group (FSR)
    • Grindrod (GND)
    • GrowthPoint (GRT)
    • Holdsport (HSP)
    • Harley-Davidson (HOG)
    • Hyprop (HYP)
    • Hyprop (HYP)_1Jun2016
    • Investec Property Fund (IPF)
    • JSE (JSE)
    • Massmart (MSM)
    • MediClinic (MEI)
    • MTN (MTN)
    • MTN (MTN)_May2016
    • Mr Price Group (MRP)
    • Mr Price Group (MRP)_8APR2016
    • Nedbank (NED)
    • OneLogix (OLG)
    • Peregrine Holdings (PGR)
    • Pick 'n Pay Stores (PIK)
    • Pioneer Foods (PFG)
    • PSG Group (PSG)
    • Quantum Foods (QFH)
    • RCL Foods (RCL)
    • Remgro (REM)
    • Richemont (CFR)
    • RMB Holdings (RMH)
    • Rolfes (RLF)
    • Sanlam (SLM)
    • Sasol (SOL)
    • Sasol (SOL)_18sep2016
    • Santova (SNV)
    • Spar Group (SPP)
    • Shoprite Holdings (SHP)
    • Spur Corporation (SUR)_7Sep2017
    • Standard Bank (SBK)
    • Steinhoff International Holdings (SNH)
    • Stor-Age (SSS)
    • Super Group (SPG)
    • Taste Holdings (TAS)_30May2016
    • The Foshini Group (TFG)
    • Value Logistics (VLE)
    • Vodacom (VOD)
    • Wilson Bayly Holmes Ovcon (WBO)
    • Woolworths (WHL)
    • Woolworths (WHL)_24Aug2017
    • Zeder (ZED)
  • Online Calculators
    • Rand Petrol Price Estimator
    • Share Valuation
    • Financial Ratios Calculator
    • GDP Growth Estimator
    • Future Value of Investment Calculator
    • Loan repayment calculator
  • Contact
  • About
  • Search