|
Related Topics |
|
In today's blog we take a look at South African retail giant Mr Price's latest financial results update. Note this is a brief update on their results and we will do a full share valuation on Mr Price soon. The updated results review and valuation can be found here once updated.
Note data from the graphs obtained from PSG |
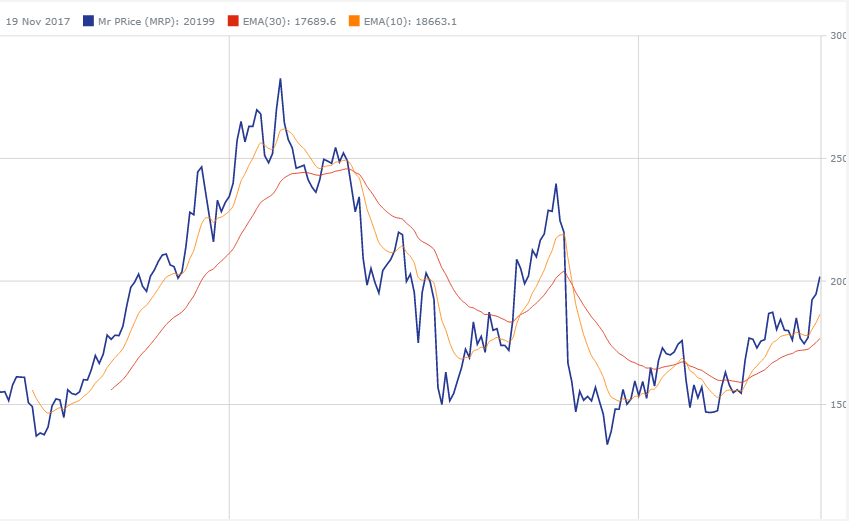
MRP technical analysis chart
|
Trading update
Below a brief summary from Mr Price (MRP) results announcement as published on 20 November 2017:
Mr Price today announced an increase in diluted headline earnings per share of 23.6% to 434.1 cents and interim dividend per share of 22.3% to 279.0 cents.
”We’re pleased with the resilience of our business model and fortitude shown by our associates. They produced really solid results in extremely challenging trading conditions and I am proud of the way they have responded,” said CEO Stuart Bird.
Total revenue rose 6.7% to R9.8bn as total retail sales of R9.1bn increased 6.4% and finance and other income increased by 11.2% to R643.3m. Sales in comparable stores were up 4.6%. Cash sales grew 7.2% and constitute 82.4% of total sales while credit sales were 5.1% higher. Retail selling price inflation was 2.6% and 97m units were sold, an increase of 4.2%. Weighted average trading space growth was in line with last year at 2.3%. The number of stores opened during the trading period increased by 24 to 1 240.
Total input cost growth was limited to 3.9%, with the improvement in gross profit margin of 280 basis points to 42.0% providing leverage to drive operating profit growth of 22.0% to R1.5bn. The operating margin increased by 200 basis points to 15.7% of retail sales and other income (RSOI).
Earnings growth was driven by MRP Apparel, Miladys and MRP Money. Earnings in the Home chains and MRP Sport declined. These chains’ retail merchandise is more discretionary in nature and hence the results are reflective of weak consumer confidence and a low growth economy. “Product execution and value proposition have remained strong, but they were up against a strong performance in the comparable period, when double digit increases in operating profits were achieved,” said Bird.
The Apparel chains’ RSOI increased by 9.0% to R6.9bn. Operating profit increased by 42.5% (PY decrease of 26.7%) to R1.1bn and the operating margin improved from 12.3% to 16.1%. Sales in MRP Apparel grew 10.2% (comparable 7.8%) to R5.6bn. In South Africa, store and online sales were up 10.5% and 29.7%, respectively. Non South African sales were up 6.2%. The division has the highest number of Facebook fans and Instagram followers in the SA fashion retail sector, while YouTube views have more than doubled. “With regard to the impact of foreign retailers, our numbers show that our sales growth is generally better in locations where we compete with them,” said Bird. Miladys sales increased by 11.9% (comparable 11.8%) to R651.8m and despite the positive overall performance, there are still merchandise opportunities to capitalise on. MRP Sport grew sales by 1.5% (comparable -4.6%) to R644.0m.
The Home chains’ RSOI decreased by 0.6% to R2.3bn. Operating profit decreased by 16.2% to R304.7m and the operating margin decreased from 15.9% to 13.4%. Sales in MRP Home were down 2.0% (comparable -3.4%) to R1.6bn, but would have been flat had it not been for the temporary closure of a flagship store due to storm damage. Sheet Street grew sales by 2.1% (comparable 1.1%) to R694.7m.
MRP Money recorded an increase in interest and credit related charges of 6.6% and insurance products of 15.2%. Cellular revenue was 5.0% lower due to product mix changes which delivered higher profitability.
The balance sheet remains strong, with cash generated from operations increasing by 15.9% to R1.3bn and cash resources of R1.6bn. Inventories are 2.6% higher and are in better shape than last year. The debtors book remains well controlled, with a retail net bad debt to book ratio of 5.9% and an impairment provision of 7.3%.
“We successfully transitioned to our new distribution facility in Hammarsdale on time and within budget and focus will now be aimed at realising the longer term financial benefits therefrom,” Bird added.
The company is very concerned about the potential impact relating to sovereign ratings reviews and political outcomes. However the positive early signs of summer trading are encouraging, with October sales increasing by 8.3% and further momentum being gained going into November.
The chart below is a technical analysis chart of MRP share price history over the last 4 years.
From the interactive chart above, its clear that MRP share price has been extremely volatile over the last number of years, with massive share price increases and declines over the last 4 years. However it has showed positive signs in recent months, and the EMA10 and EMA30 lines both trending upwards and the fact that the EMA10 crossed aboved the EMA30 signaled a buy in early July and the uptrend has been cemented since.
MRP shareholders will be happy with the statement made that summer trade has been encouraging and has been continuing for MRP, showing that their slump experienced when H&M for example aggressively stole some of their market share seems to be a thing of the past.
So which divisions contributed to MRP's operating profits (profit before taxes)? Below the numbers:
Apparel: R1,11billion (68% of operating profit)
Home: R305million (18.2%)
Financial services and cellular: R202million (13.8%)
Total Profits for 6months ending September 2017: R1.617billion
So which divisions contributed to MRP's operating profits (profit before taxes)? Below the numbers:
Apparel: R1,11billion (68% of operating profit)
Home: R305million (18.2%)
Financial services and cellular: R202million (13.8%)
Total Profits for 6months ending September 2017: R1.617billion
Let us know what you thought of this article: |