|
Related Topics |
|
We take a look at the latest ABSA Purchasing Managers' Index for South Africa for the months of December 2019. What does it say about South Africa's economic activity towards the end of 2019 and does it tie in to IHS's PMI?
|

|
What is the ABSA Purchasing Managers Index (PMI)?
The Absa Purchasing Managers’ Index™ (PMI™) compiled by the Bureau for Economic Research (BER) and sponsored by Absa, is based on the widely used and highly regarded Purchasing Managers Index (PMI) produced by the Institute for Supply Management (ISM) in the USA.
The PMI is calculated as the weighted average of the following indices (weights in parentheses): Business Activity (0.05), New Orders (0.20), Employment (0.20), Supplier Deliveries (0.40) and Inventories (0.15).
The survey from which the indices are compiled require the respondents to indicate each month, whether a particular activity (e.g. production) for their company has increased, decreased or remained unchanged. The indices are then calculated by taking the percentage of respondents that reported an increase and adding it to one-half of the percentage that reported no change. This results in an index for which a value of 50 indicates no change in the activity, a value above 50 indicates increased activity and a value below 50 indicates decreased activity.
ABSA Purchasing Managers Index (PMI) for December 2019
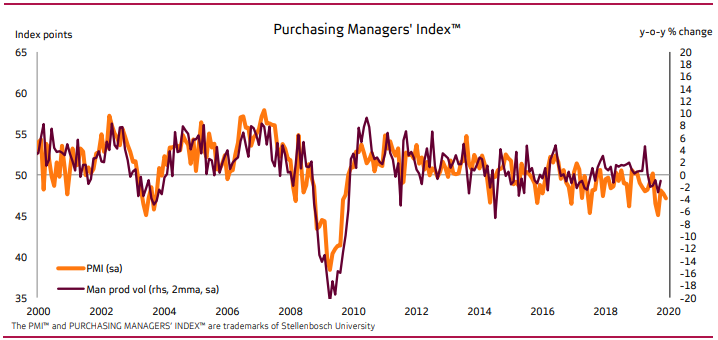
The seasonally adjusted Absa Purchasing Managers’ Index (PMI) edged lower to 47.1 index points in December 2019 from 47.7 points recorded in November. The December figure is about one point below the average recorded through 2019. In any case, the PMI paints a bleak picture of the performance of the manufacturing sector through the year as the headline PMI only managed to edge above 50 points for two months in the year. Bouts of load shedding and persistent weak domestic demand coupled with more intense headwinds from the global economy likely weighed on activity during the year.
In December, two of the major subcomponents registered fairly large declines. The new sales orders index slumped to record the lowest level seen in 2019. Part of this may stem from weaker external demand as respondents noted a drop in exports for a second consecutive month. Driven by the drop in demand, business activity also fell in December. Activity was further hampered by the return of load shedding during the month, with some respondents specifically flagging electricity disruptions as the reason for lost production time. These declines were, to some extent, countered by smaller improvements in the three other subcomponents: employment, inventories and supplier deliveries. However, of these three, only supplier deliveries came in above 50 points with the others still pointing to a worsening of conditions. The index tracking expected business conditions in six months’ time declined again in December after a slight improvement in November. The index fell to 45.9 from 47.4 in November. This is in stark contrast to the start of 2019 when the index was at a lofty 67.2 points. The return of load shedding likely soured expectations in December, while some may be concerned that export demand could continue to falter in the first half of 2020.
The purchasing price index rose in December to reach 65.8 index points, from 63.3 in the month before. Despite the increase, the index remains fairly low after sharp declines in October and November.
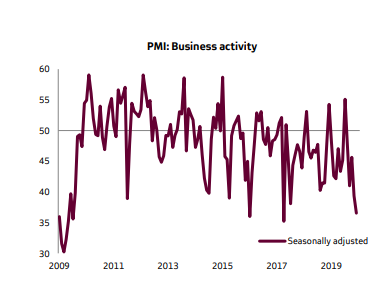
One of the sub-components of the PMI that we want to highlight is the Business Activity Index. Below a brief summary of the Business Activity index as obtained from the Bureau of Economic Research (BER).
The business activity index fell further in December after a sharp drop was recorded in November. The index declined to the lowest level since April 2017. Some of the respondents highlighted electricity load shedding as a cause for the drop in production during the final month of the year. The risk of further load shedding in January dampens expectations for a strong recovery in output at the start of 2020.
The image below shows the business activity index (seasonally adjusted), a sub-component of the PMI
The story being told by the PMI and the business activity sub-component is not a good one. And it points to further declines in economic activity in South Africa, which recorded negative economic growth of -0.6% in the 3rd quarter of 2019. And this is in line with IHS's PMI numbers which showed sluggish private sector activity in South Africa during the latter part of 2019. Based on these numbers there is little to no hope of a economic recovery in South Africa any time soon.